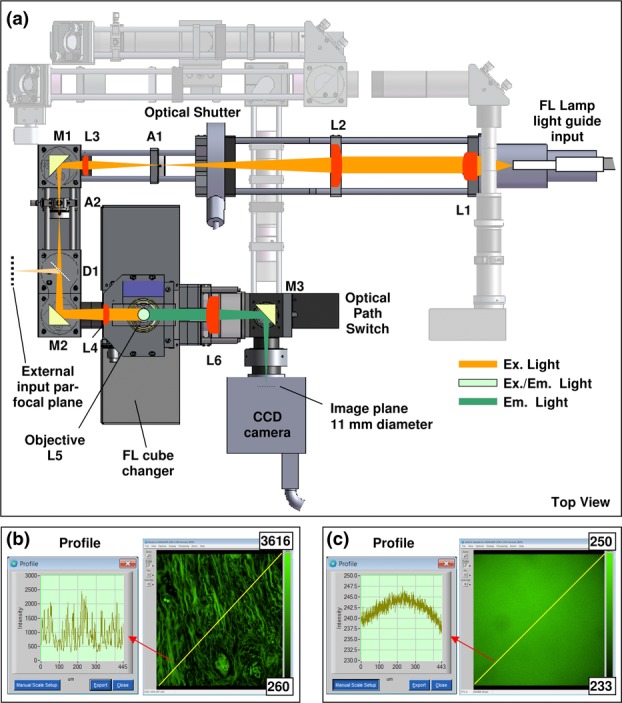
Figure 2.

(a) Fluorescence (FL) excitation path for camera-based imaging: L, lens; A, aperture; M, mirror; D, dichroic mirror. The possibility for an additional excitation source is shown entering from the left via D1. (b) Example image of hematoxylin and eosin stained tissue taken with a FL cube for Cy2 with profile of a line drawn in yellow from bottom right to top left. (c) An average of 10 images of a uniform fluorescent sample at semi-random stage positions to even out tissue structure (normalized display bit depth) showing flat illumination to within 4% over the image (note the expanded vertical scale).
