Figure 5.
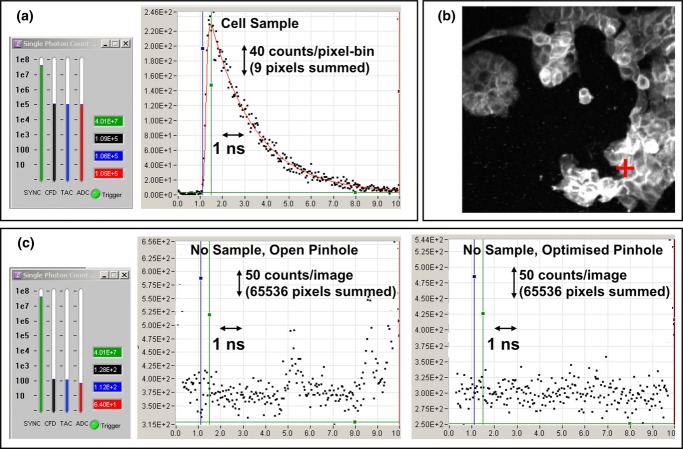
Comparison of FLIM signal versus background counts. (a) User interface showing a typical imaging photon count rate of approximately 105 per second (at the CFD, TAC and ADC stages of the TCSPC electronics) and the transient signal from a 3 × 3-pixel binned area of an image of A431 human epithelial carcinoma cells expressing cdc42-GFP. (b) The image produced with the location of the highlighted 3 × 3 area (red cross). (c) With no sample present, and using the same excitation intensity, the count rates are approximately 100 per second and transients accumulated from all pixels in an image (65,536 pixels) show the background signal structure with the confocal pinhole (A5 in Figure 3) fully open (showing some residual optical reflections) and optimally sized. (Blue and green lines on the graphs are cursors marking detected excitation time extremes.)

