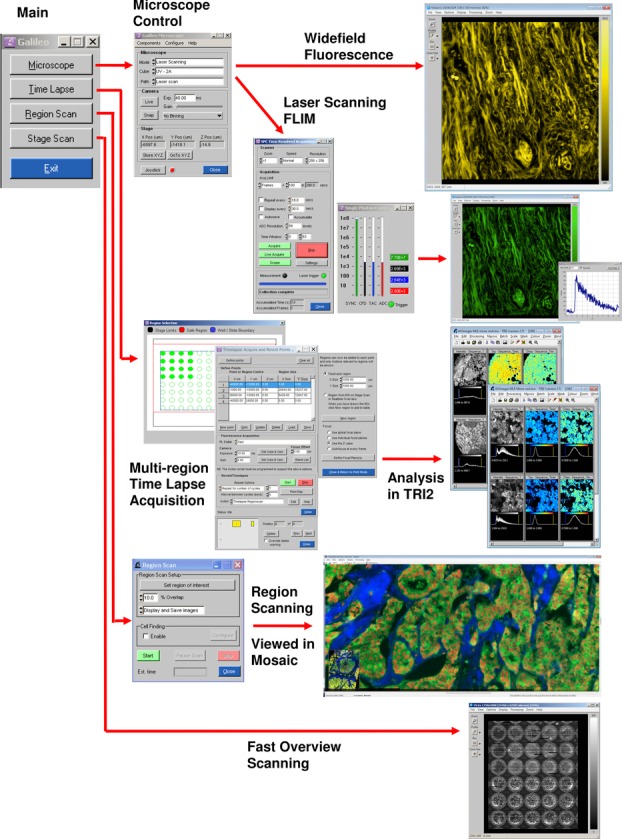
Figure 6.

Schematic diagram showing the main functions of the Abbe microscope with associated software panels. From top to bottom: General microscope control with fluorescence wide-field and laser scanning FLIM; Multiregion time-lapse acquisition of multiwell plates and tissues resulting in batch analysis with the TRI2 program; Region scanning by tiling multiple fields and viewed in the Mosaic program; Fast overview of the sample by ‘stage scanning’.
