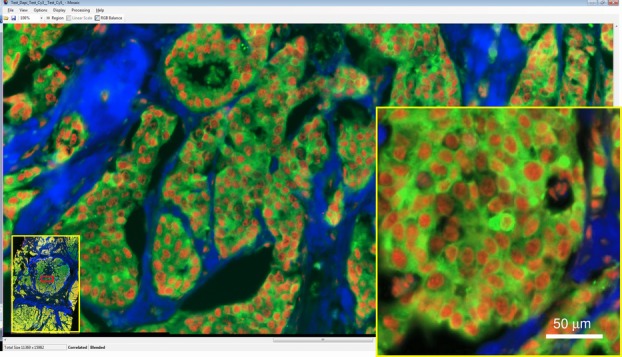
Figure 7.

Multichannel image tiling with edge correlation and blending of breast tissue labelled with anti-ezrin IgG-Cy2 (Green) and anti-phospho PKCα (T250) IgG-Cy3 (Red), together with an a UV-2A cube filter set image (Blue). A 500 μm wide view from 3.3 mm wide 184 Mpixel image. The dataset was assembled and rendered in our Mosaic program with complete slide overview at bottom left and red rectangle of current view which is displayed as a full resolution image in the main display. Inset is a high-resolution view.
