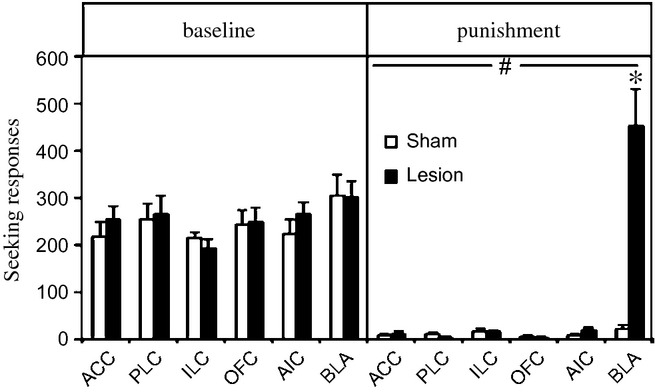
Figure 2.

Average number of seeking responses during the 4 days before (baseline; left side) or during the last 4 days (punishment; right side) of punishment of rats with lesions to the ACC, PLC, ILC, OFC, AIC and BLA (black bars) and their counterpart sham controls (white bars). Data are expressed as mean ± standard error of the mean of 10–16 rats per group. Significantly different from baseline: #P < 0.001. Significant difference between sham and lesioned rats: *P < 0.001.
