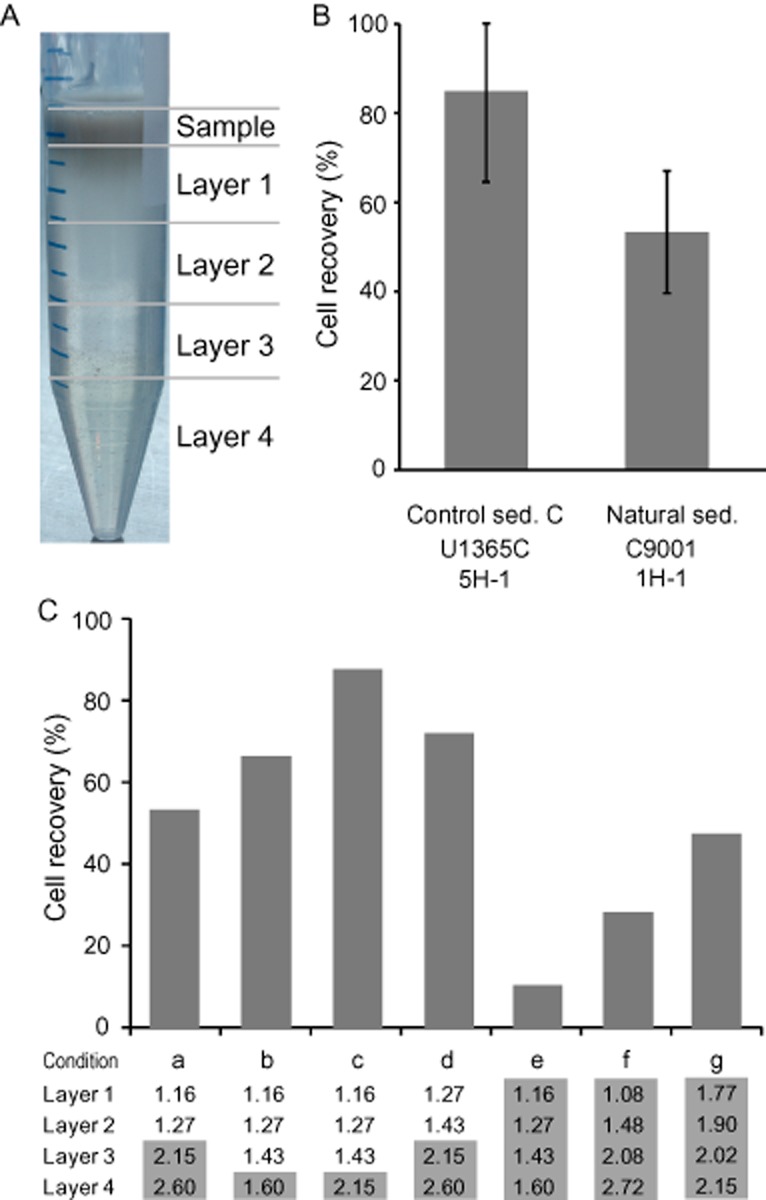
Figure 3.

Standardization of the multilayer density separation method.A. Photograph illustrating the appearance of the multiple density layers after centrifugation.B. Percent recovery of Escherichia coli cells from control sediment C and natural cells from sediment sample (Site C9001, Core 1H-1). Density layers: 1.16 and 1.27 g cm−3 with Nycodenz and 2.15 and 2.60 g cm−3 with sodium polytungstate. Bars show the standard deviation (n > 10).C. Optimizing the number of density layers. Seven different composition of density layers (a–g) were compared for cell separation efficiency. The density (g cm−3) of each layer is shown below the bar graph. Values shaded in gray represent layers of sodium polytungstate.
