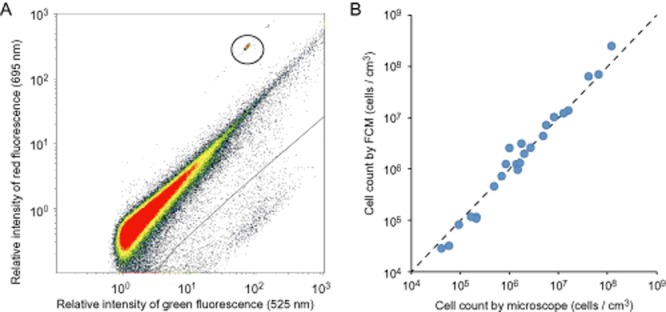
Figure 5.

FCM analysis of density-separated sediment samples.A. FCM cytogram (scatter plot) of the sample from Site C9001, Core 1H-1 following separation and staining with SYBR Green I. Lower right portion below the solid line shows the region of cell-derived fluorescence signals. Signals surrounded by a solid circle are from volume calibration beads.B. Number of microbial cells as determined by microscopic counting and FCM. Dotted line shows the 1:1 line for the counts determined by microscopy and FCM.
