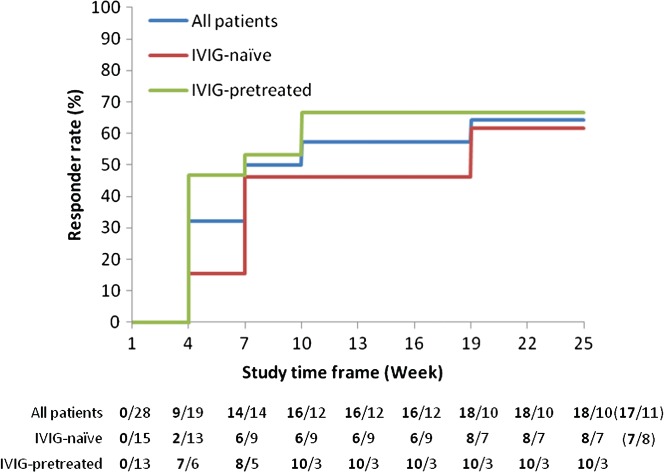
Figure 4.

Response to treatment based on adjusted Inflammatory Neuropathy Cause and Treatment (INCAT) score by intravenous immunoglobulin (IVIG)-pretreatment (ITT). Kaplan–Meier analysis of the proportion of responders based on the adjusted INCAT score is shown for all patients (blue), IVIG-naïve (red), and IVIG-pretreated (green) patients in the ITT analysis. The number of patients, who have achieved a response at least once by the time point (n), followed by the number of patients who have not yet responded (N) is indicated as ‘n/N’ below the graph. Please note that this analysis included 1 patient who had a response at Week 19 and Week 22 but not at completion (Week 25), resulting in 18 responders, 17 of which were responders at completion (shown in brackets).
