Figure 5.

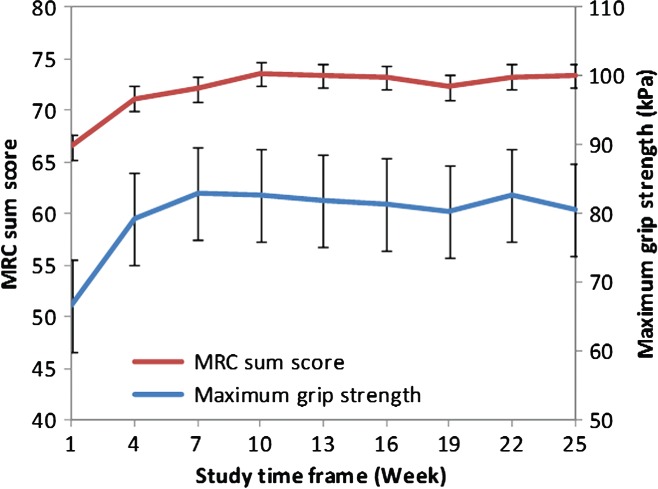
Mean maximum grip strength and mean MRC sum score over time (ITT). The mean maximum grip strength of dominant hand and mean MRC sum score is shown for all patients in the ITT analysis. Error bars represent the standard error of the mean.

Mean maximum grip strength and mean MRC sum score over time (ITT). The mean maximum grip strength of dominant hand and mean MRC sum score is shown for all patients in the ITT analysis. Error bars represent the standard error of the mean.