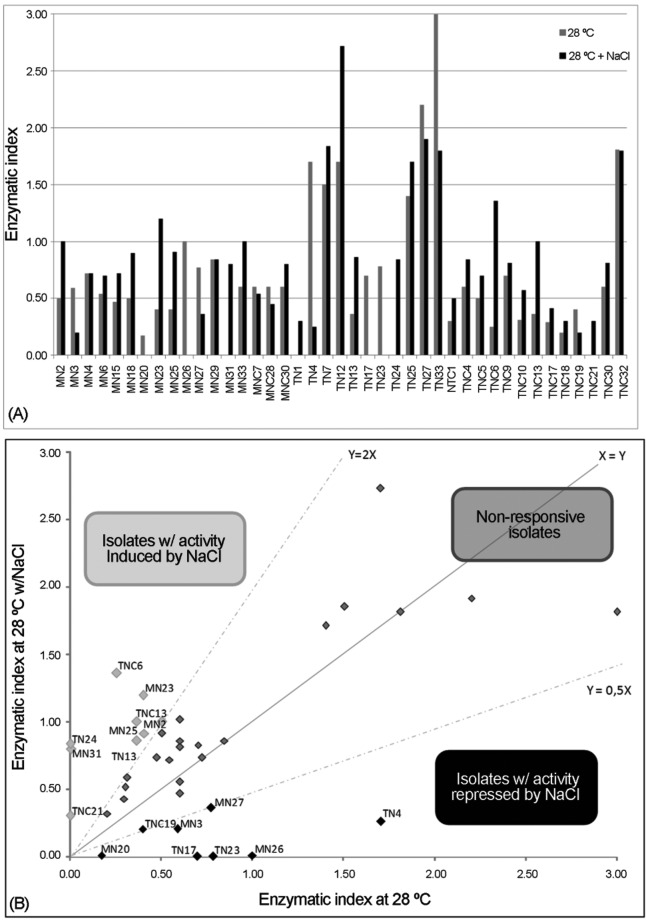
Figure 1.
Cellulase production by the isolates in mangrove sediment under two salinity conditions. (a) The results are presented as an index of enzyme activity, calculated by dividing the diameter of the halo by the diameter of the colony. (b) Relationship between the activities in the two conditions. Values indicating an increase or decrease in the two halos are represented by the lines y = 2× and y = 0.5×, respectively. Additionally, the names of the isolates with activity modulated by salinity are presented.

