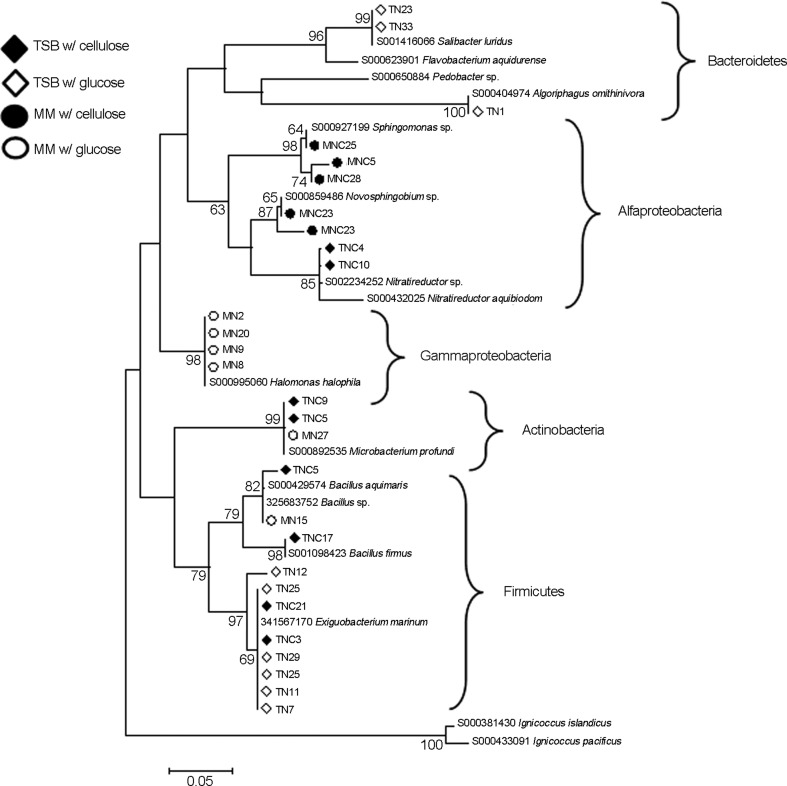
Figure 3.
Phylogenetic relationships based on partial 16S gene sequences of bacterial isolates from mangrove sediment with the best matches from the databases (12, 27). The alignment was constructed by Mega 4.1 software (35) followed by clustering using neighbor joining and the Kimura-2 parameter. A bootstrap analysis was performed with 1,000 repetitions, and values indicate the percentage of clustering matching. The bar in the bottom of the figure scales the number of differences in base composition among the sequences.

