
Figure 1.
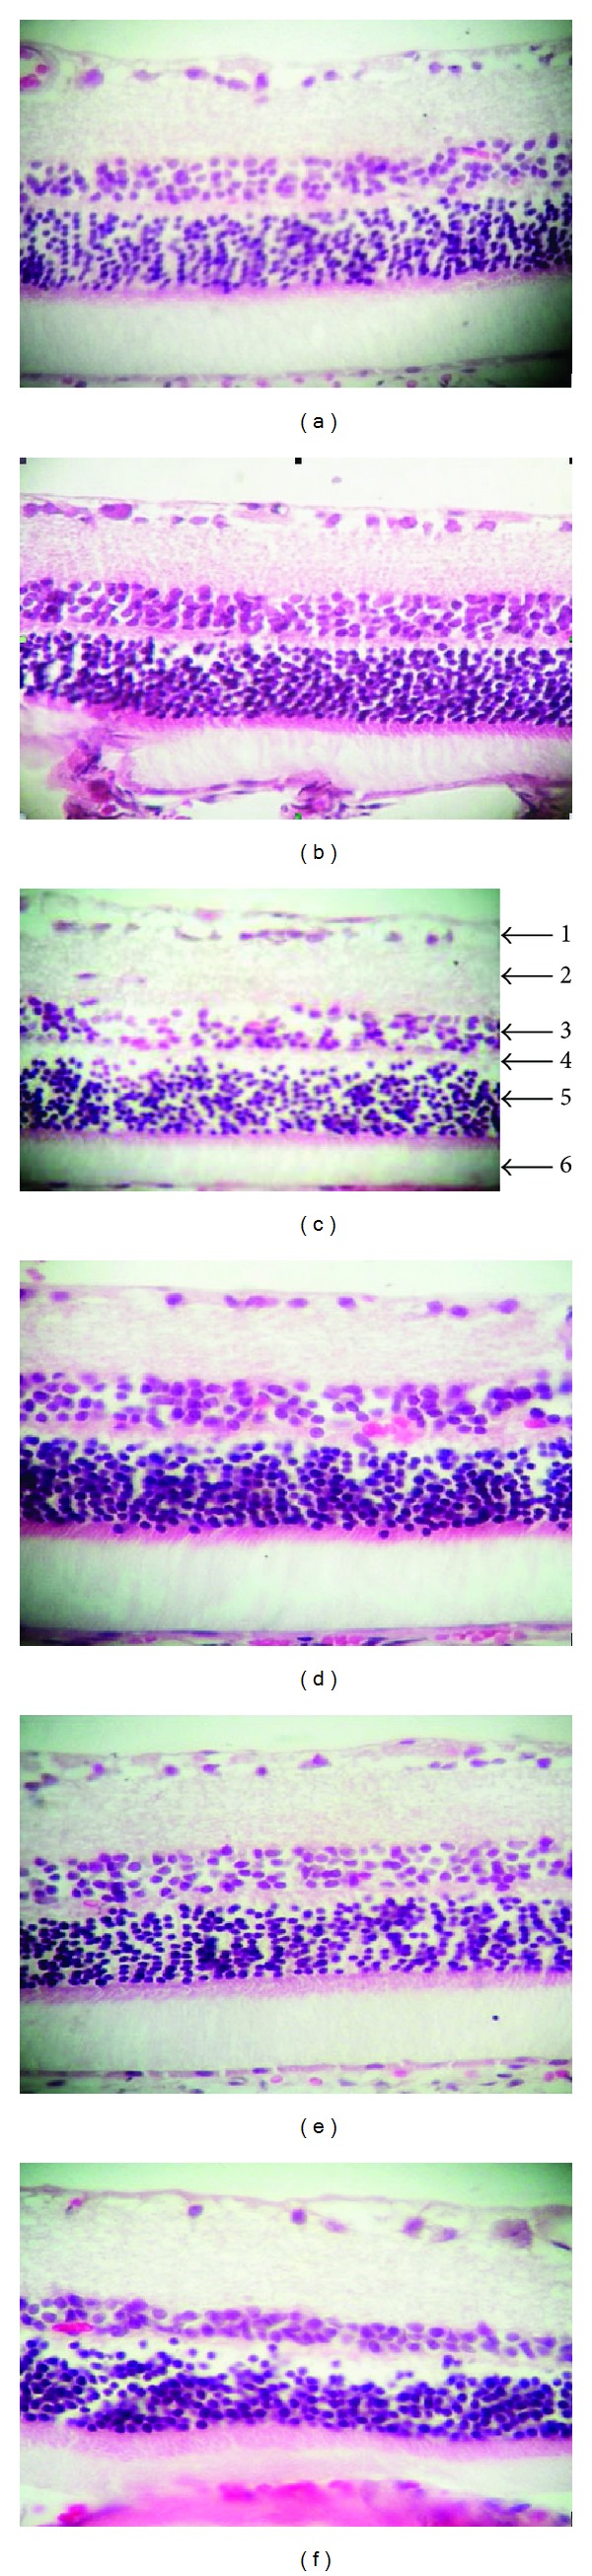
The morphology of retinal structure under light microscope (hematoxylin-eosin staining ×400). (a–c) Control group; (d–f) diabetic group. Numbers 1–6 represent layers of ganglion cell, inner plexiform, inner nuclear, outer plexiform, outer nuclear, rods, and cones.