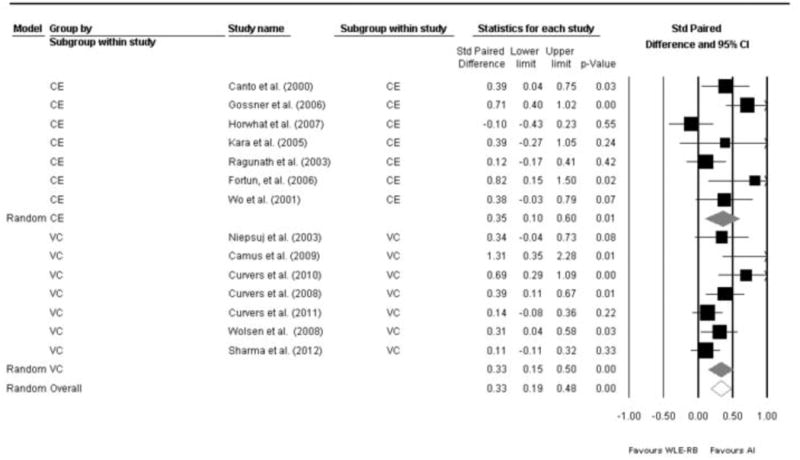
Figure 3.

Forest plot of the 14 studies stratified by imaging modality (Virtual Chromoendoscopy in the top 7 studies, compared to chromoendoscopy in the bottom 7 studies) with pooled risk difference. Overall pooled risk difference is also shown.

Forest plot of the 14 studies stratified by imaging modality (Virtual Chromoendoscopy in the top 7 studies, compared to chromoendoscopy in the bottom 7 studies) with pooled risk difference. Overall pooled risk difference is also shown.