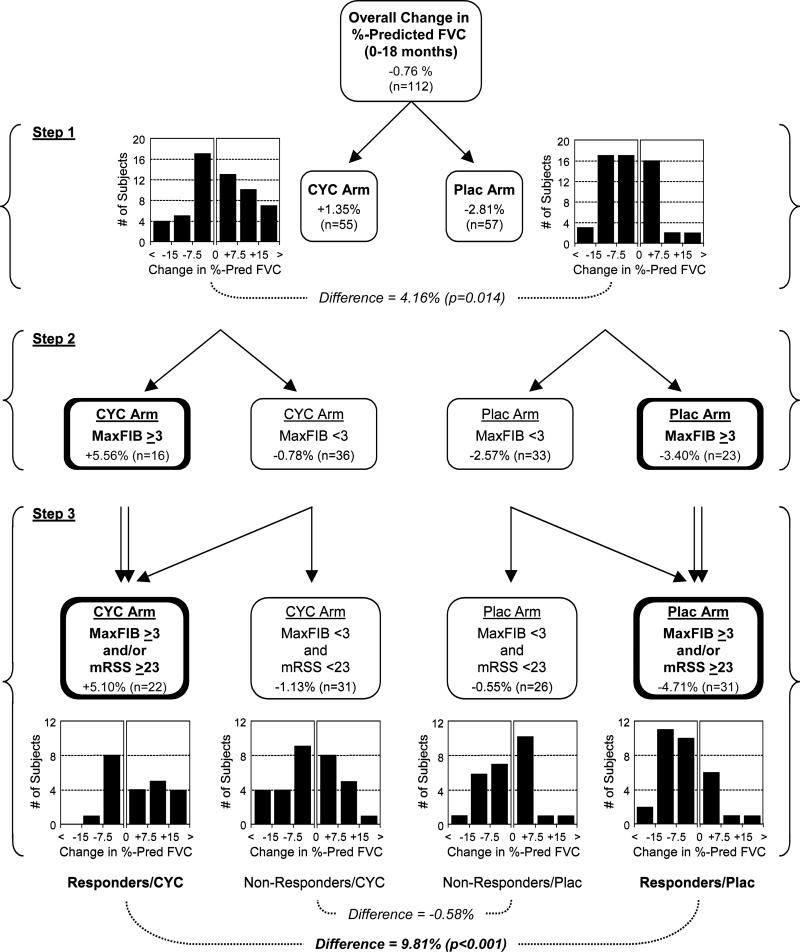
Figure 2. Multivariate tree regression analysis.
In Step 1, the study population was dichotomized into those assigned to the CYC versus placebo arms. The mean change in %-predicted FVC from 0 to 18 months is indicated, as are the applicable subjects numbers (N) and histograms demonstrating the number of subjects with different ranges of change in %-predicted FVC. The difference between groups and the resulting p-value are also shown. In Step 2, each group was further subdivided into two subsets based on the MaxFIB score. In Step 3, subjects were again subdivided based on their mRSS score. Rather than dividing each treatment arm into 4 different subsets, subjects with a MaxFIB score ≥3 and/or a mRSS ≥23 were pooled into one group and subjects with a MaxFIB score <3 and a mRSS <23 were left as the alternative grouping. When the resulting populations were compared, a CYC responsive group was identified with an average treatment effect of 9.81%. Conversely, the subset with a low MaxFIB score and a low mRSS demonstrated no significant CYC treatment effect.

