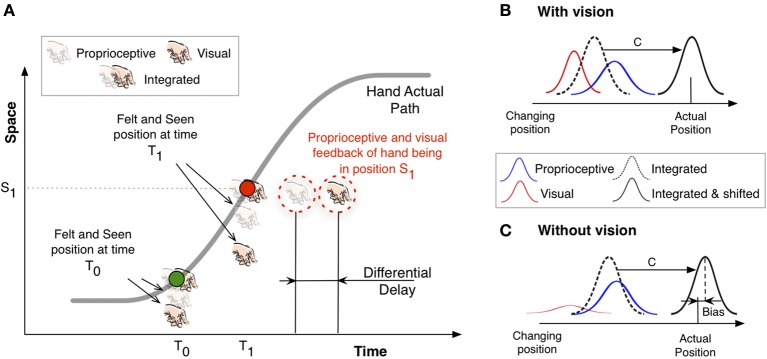
Figure 1.

Sketch to illustrate our rationale. (A) The gray curve denotes the actual path traveled by a hand: the changing position in one dimensional space is plotted against time. The slope of the curve at any given point describes the tangential velocity at this particular time. The green and red points therefore correspond to moments at which the hand moves slowly early in the path (green) and when it moves at the highest speed half way to the target (red). See text for details. (B) Sketch of the position estimate based on integrated information. The dashed curve denotes the integrated estimate based on visual feedback (red) and proprioceptive feedback (blue). A constant shift is assumed to correct for the sensory delays. (C) The same as (B) but without visual information. The visual estimate (red) has a larger uncertainty.
