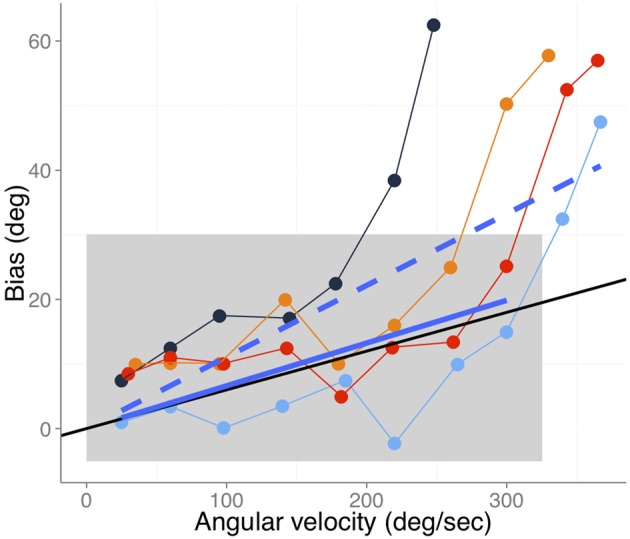
Figure 3.

Bias as a function of angular velocity adapted from Gritsenko et al. (2007), (Figure 7A) for the different active movement conditions. Different colors code the angles at which the probe was shown while moving the arm (60, 75, 90, and 105° in blue, black, orange, and red respectively). The black line denotes the expected bias assuming a differential delay of 60 ms between vision and proprioception. The blue solid line denotes the best fit (slope 0.066 s and zero intercept) including the data points that fall within the gray rectangle. The dashed solid line (slope 0.133 s and zero intercept) denotes the fit to all data points.
