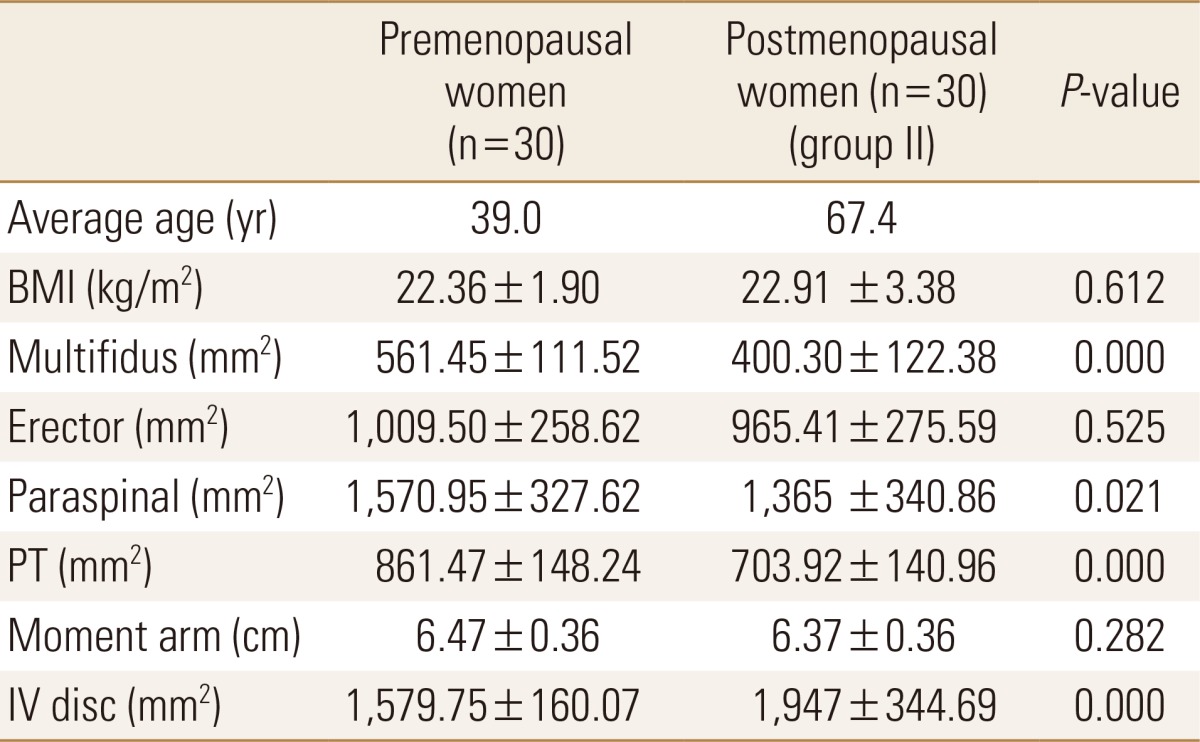
Table 2.
Comparison of between group II and control group

Data are expressed as means±SD.
Statistically significant at the 0.05 level.
BMI, body mass index; PT, psoas major muscle; IV, intervertebral.
Comparison of between group II and control group

Data are expressed as means±SD.
Statistically significant at the 0.05 level.
BMI, body mass index; PT, psoas major muscle; IV, intervertebral.