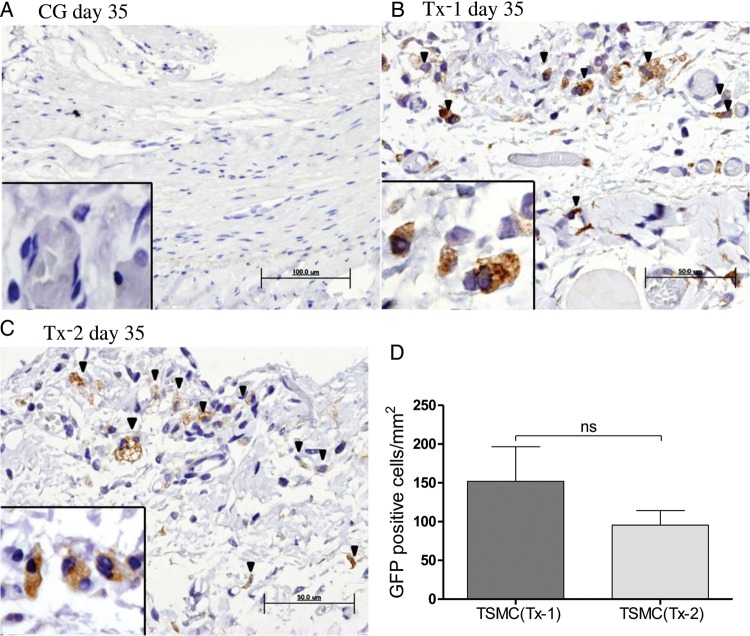
FIGURE 3:
Appearance of GFP-positive TSMCs in the peritoneum (×400, n = 5 in each group). (A) Rat in the CG group at Day 35. (B) Rat in the Tx-1 group at Day 35. (C) Rat in the Tx-2 group at Day 35. (D) The number of GFP-positive cells in the Tx-1 group was almost similar with that in the Tx-2 group. Error bars represent SD.

