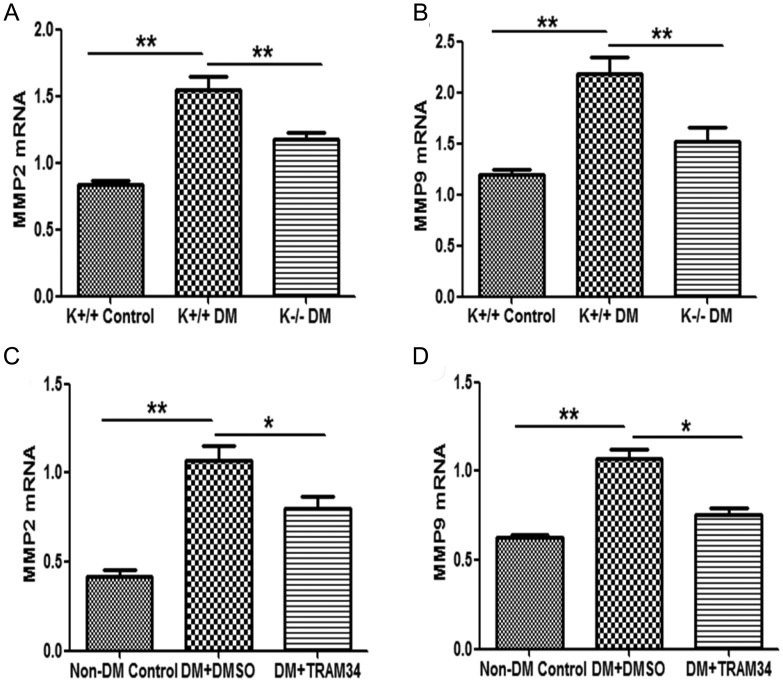
FIGURE 7:
Blockade of KCa3.1 inhibited MMP2 and MMP9 expression in two STZ-induced diabetic models. Quantitative RT–PCR showed increased mRNA expression of MMP2 (A) and MMP9 (B) in the kidneys of diabetic KCa3.1+/+ mice compared with control mice but reduced in diabetic KCa3.1−/− kidneys (n = 8). Quantitative RT–PCR showed increased mRNA expression of MMP2 (C) and MMP9 (D) in the kidneys of eNOS−/− diabetic mice compared with control mice but reduced in diabetic kidneys treated with TRAM34 (n = 6). Results are presented as mean + SEM. *P < 0.05 and **P < 0.01.

