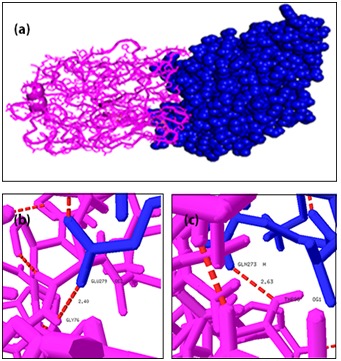
Figure 4.

Docking interaction of MAPT with GSK3B and its interatomic hydrogen bonds with distances. Red color dash lines represent the hydrogen bonds interactions between the amino acid residues: a) Docked complex structure of MAPT (cartoon representation in pink) and GSK3B (sphere representation in blue); b) Interatomic hydrogen bonds between THR95 and GLN 273; c) Interatomic hydrogen bonds between GLY 76 and GLU 279.
