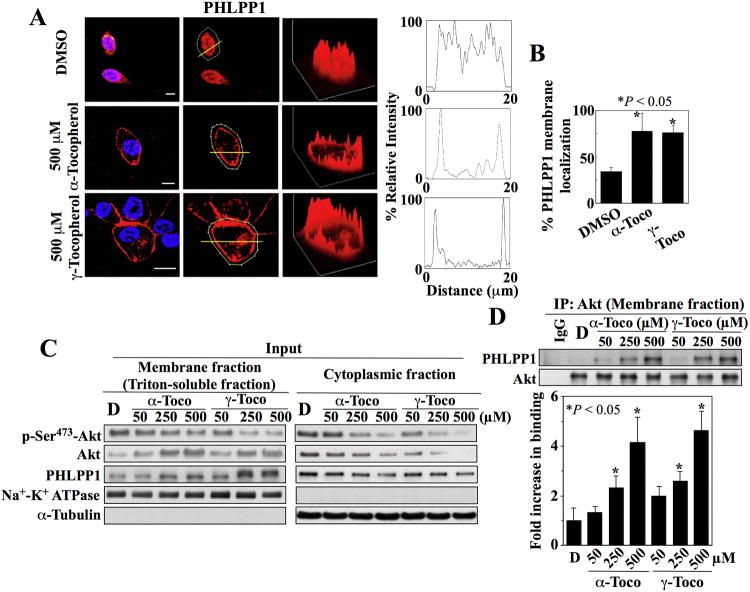
Fig. 2. Tocopherols facilitate the co-localization of Akt and PHLPP at the plasma membrane.
(A) Plasma membrane localization of PHLPP1 in LNCaP cells exposed to α- and γ-tocopherol. Left, Immunofluorescence staining of PHLPP1 (red) and DAPI-stained nuclei (blue). x, y, and z axes, μm. Scale bars, 40 μm. Center, Analysis of fluorescent intensity in individual cells. Yellow lines indicate cross-sectional planes of analysis. Right, Three-dimensional surface plots of whole cell fluorescence intensities and two-dimensional histograms of cross-sectional fluorescence intensities. Replicate data are shown in fig. S2D. (B) Percentages of cells that exhibited membrane localization of PHLPP1 in the experiments described in (A) are shown. *, P < 0.05 compared to DSMO control (Kruskal-Wallis; 15 - 40 cells were analyzed for each treatment condition in 3 independent experiments. (C) Representative Western blot of the effects of α-tocopherol (α-Toco) and γ-tocopherol (γ-Toco) on the abundance of Akt phosphorylation at Ser473 (p-Ser473-Akt), Akt, and PHLPP1 in the membrane (left) and cytoplasmic (right) fractions of LNCaP cells. (D) Co-immunoprecipitation of Akt-PHLPP1 complexes from the membrane fractions isolated in (C). A representative immunoblot and densitometric analysis of the relative abundance of PHLPP1 immunoprecipitated with Akt from 3 independent experiments are shown. Signals from immunoprecipitated PHLPP1 were normalized to that of total Akt (means ± S.D.). Replicate Western blots and co-immunoprecipitation data are shown in fig. S2E. *, P < 0.05 compared to DMSO control (one-way ANOVA).

