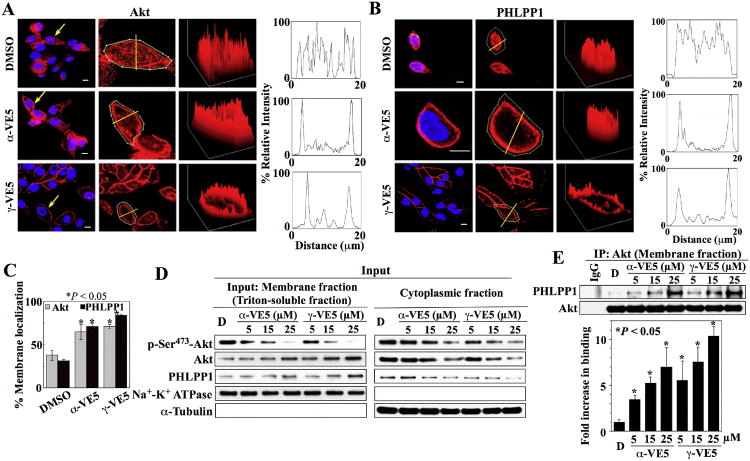
Fig. 4. α-VE5 and γ-VE5 facilitate the recruitment of Akt and PHLPP1 to the plasma membrane.
Plasma membrane localization of (A) Akt and (B) PHLPP1 in LNCaP cells exposed to α- and γ-VE5. Left, Immunofluorescence staining of Akt or PHLPP1 (red) and DAPI-stained nuclei (blue). Arrows indicate cells selected for analysis of fluorescence intensity through a cross-sectional plane (center, yellow lines). Right, Three-dimensional surface plots of whole cell fluorescence intensities and two-dimensional histograms of cross-sectional fluorescence intensities. x, y, and z axes, μm. Scale bars, 40 μm. Replicate data are shown in figs. S4A and S4B. (C) Percentages of cells that exhibited membrane localization of Akt and PHLPP1 in the experiments described in (A) and (B) are shown. *, P < 0.05 compared to DMSO control (one-way ANOVA; for Akt, 49 - 101 cells were analyzed for each treatment condition in 3 independent experiments, and for PHLPP1, 32 - 47 cells were analyzed for each treatment condition in three independent experiments). (D) Representative Western blot of the effects of α- and γ-VE5 on the abundance of Akt phosphorylation at Ser473 (p-Ser473-Akt), Akt, and PHLPP1 in the membrane (left) and cytoplasmic (right) fractions of LNCaP cells. (E) Co-immunoprecipitation of Akt-PHLPP1 complexes from the membrane fractions isolated in (D). A representative immunoblot and densitometric analysis of the relative abundance of PHLPP1 immunoprecipitated with Akt from 3 independent experiments are shown. Signals from immunoprecipitated PHLPP1 were normalized to that of total Akt (means ± S.D.). Replicate Western blots and co-immunoprecipitation data are shown in fig. S4C. *, P < 0.05 compared to DMSO control (one-way ANOVA).

