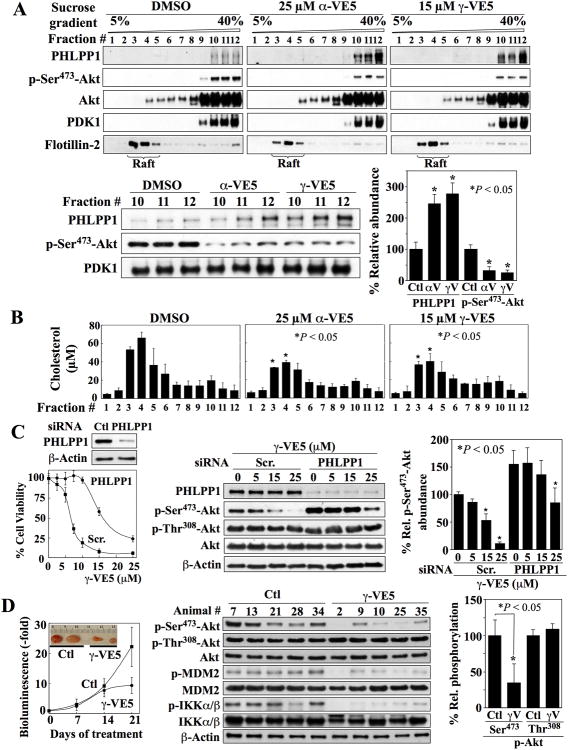
Fig. 5. α-VE5 and γ-VE5- induced co-localization of Akt and PHLPP1 to the non-raft domains of the plasma membrane, essential role of PHLPP1 in VE5-induced Akt dephosphorylation, and in vivo tumor-suppressive activity of γ-VE5.
(A) Co-localization of Akt and PHLPP1 to non-raft membrane domains in LNCaP cells treated with α- and γ-VE5. Upper panels, Representative Western blot of PHLPP1, Akt phosphorylated at Ser473 (p-Ser473-Akt), Akt, PDK1 and flotillin-2 in cell membrane subfractions. Lower panels, A representative Western blot (left) and densitometric analysis (right) of the relative amounts of PHLPP1 and Akt phosphorylated at Ser473 in the non-raft fractions 10 - 12 from 3 independent experiments are shown (means ± S.D.). Signals from PHLPP1 and phosphorylated Akt were normalized to that of PDK1, the cellular distribution of which was unchanged by α- or γ-VE5 (Fig. 6C). Replicate data are shown in fig. S5A. *, P < 0.05 compared to respective DMSO control (Kruskal-Wallis). (B) Cholesterol content in individual membrane subfractions from cells described in (A). Means ± S.D. are shown (N = 3 independent experiments). *, P < 0.05 compared to the corresponding fraction in the DMSO control (one-way ANOVA). (C) Protective effect of siRNA-mediated PHLPP1 knockdown against the suppressive effects of γ-VE5 on cell viability (Left, The means and S.D. of 6 biological replicates from a representative experiment of a total of three independent experiments are shown), and on Akt phosphorylation at Ser473 (Right, A representative Western blot and densitometric analysis of relative phosphorylation of Akt at Ser473 from 3 independent experiments are shown) in LNCaP cells. Signal from phosphorylated Ser473 was first normalized to that of total Akt, and then to that of β-actin (means ± S.D.). Replicate data are shown in fig. S5B. *, P < 0.05 compared to respective DMSO control (Welch's ANOVA). (D) Effect of γ-VE5 on the growth of subcutaneo The cDNA fragments corresponding to the putative PH domain sequences of PHLPP1 us PC-3-luc xenograft tumors (mean starting tumor volume + SE, 75.3 ± 4.5 mm3). Left, Tumor burden as represented by relative bioluminescence (means ± S.D., n = 7 mice). Inset, representative tumors from vehicle- (Ctl) and γ-VE5-treated mice. P < 0.05 compared to control at 21 days (Student's t-test). Middle, Western blot analysis of the phosphorylation status of Akt at Ser473 (p-Ser473-Akt) and Thr308 (p-Thr308-Akt), MDM2, and IKKα/β in five representative tumors from each group. Right, Densitometric analysis of relative phosphorylation of Akt at Ser473 and Thr308 in the representative tumors. Signals from phosphorylated Ser473 and Thr308 were first normalized to that of total Akt, and then to that of β-actin (means ± S.D., n = 5 tumors). *, P < 0.05 compared to control (Mann-Whitney U).

