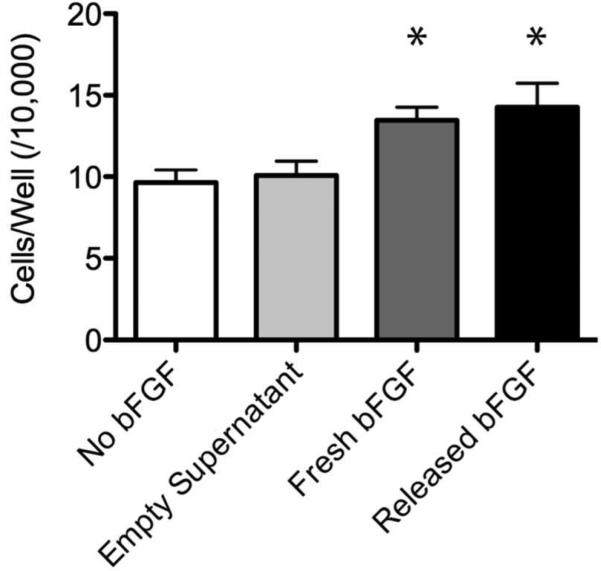
Figure 3.
bFGF activity after release from AcDex microparticles. Cell number after 24 hours of growth in growth factor activity assay (mean ± SD; *p < 0.05). The LS + fresh bFGF and LS + released bFGF groups both had significantly more cells per well than either control group (LS alone or LS + empty). In addition, the LS + Fresh bFGF and LS + Released bFGF groups were not statistically different from one another. *p<0.05 to both negative control groups.

