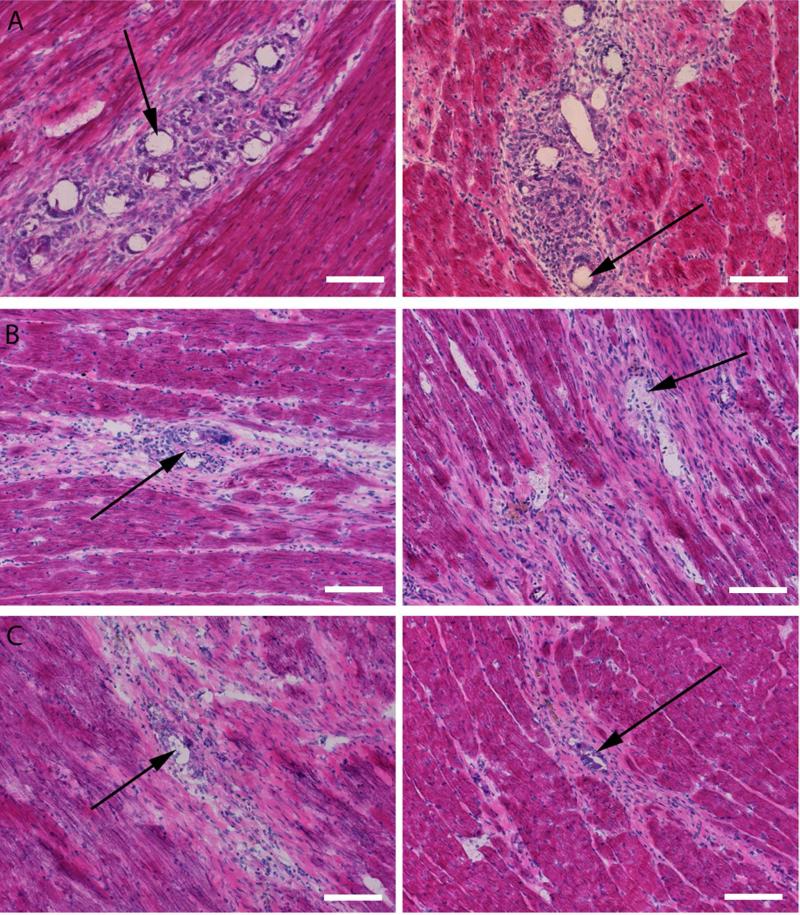
Figure 4.
Images showing AcDex biocompatibility in healthy rat hearts. H&E images from day 7 (A), 14 (B) and 28 (C) of the biocompatibility study. Spherical voids created by the particles (black arrows) are visible for both the LOW (left) and HIGH (right) groups. As particles degrade, the voids, representative of particle morphology, becomes less spherical. Scale bar: 100 μm.

