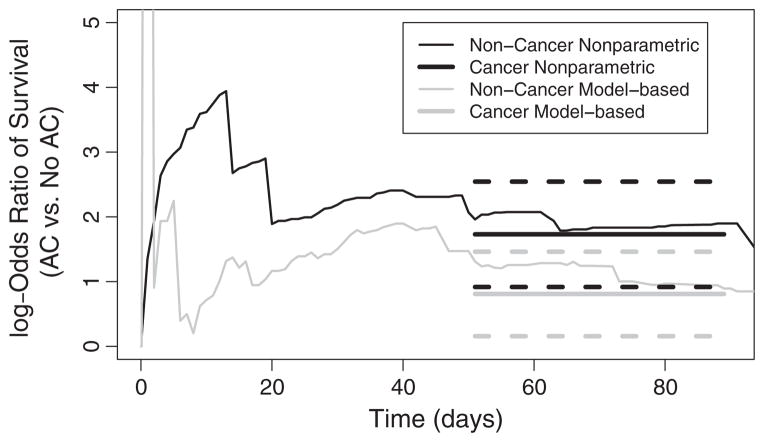
Figure 3.
Comparison of the log odds ratio for death comparing AC with no AC therapy for cancer and non-cancer patients. Using thin lines, the nonparametrically estimated log odds ratios are shown. On the right, the thick solid black and gray lines indicate the fitted parsimonious model for a common log odds ratio between 50 and 90 days. Thick dashed lines indicate 95% confidence intervals.

