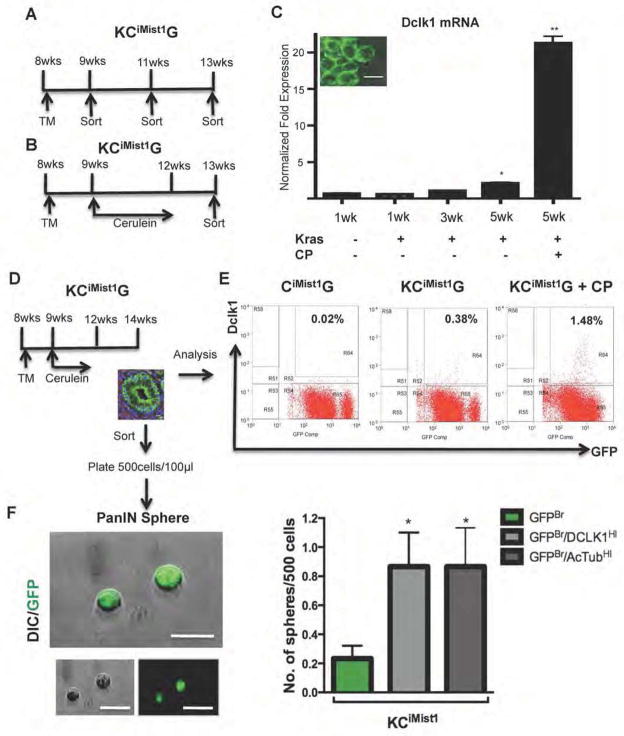
Figure 4. Dclk1 and AcTub cells show progenitor capability in preinvasive lesions.
(A,B) Schematic outline of the sorting strategy to isolate eGFP+ cells at different time points after KCiMist1G mice were treated with either tamoxifen alone (A) or tamoxifen and cerulein (B). (C) Dclk1 mRNA levels significantly increase in FACS sorted GFP+ cells during mPanIN progression (**p<0.01). Inset shows imaging confirming membrane eGFP expression in isolated cells. (D) Sorting strategy for FACS-based isolation of eGFP+ cells from PanIN bearing KCiMist1G + CP mice. To generate PanIN spheres, KCiMist1G mice were treated with tamoxifen (TM) and cerulein, then left untreated for two weeks before the isolation of eGFP+ cells. (E) FACS analysis of KCiMist1G + CP demonstrating dramatic increase in Dclk1-expressing cells. Percentages indicate fraction of all pancreatic cells comprising the Dclk1HI/GFPBr subpopulation. (F) PanIN-sphere formation by Dclk1HI/GFPBr, AcTubHI/GFPBr, and GFPBr subpopulations. Dclk1HI/GFPBr, AcTubHI/GFPBr, and GFPBr cells were FACS-sorted, plated at clonal density and cultured for seven days in low attachment plates. Graph indicates relative sphere-forming efficiency for different cell populations (*p<0.05 vs. GFPBr control).

