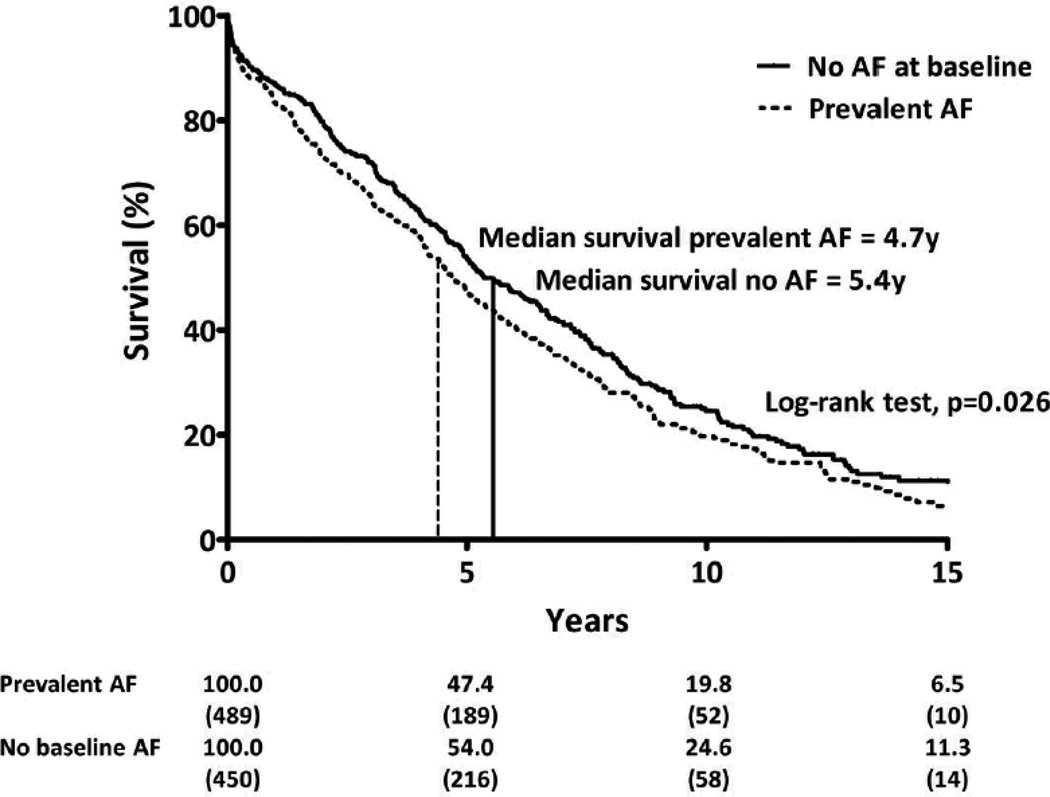
Figure 3.
Kaplan-Meier survival analysis according to rhythm status at baseline. Survival curves shown for patients with prevalent AF (dashed line) and sinus rhythm (solid line) at HFpEF diagnosis. Median survival by group shown (vertical line). Numbers given below figure are survival rates (%) and number of patients at risk (in parentheses) at each 5-year interval, truncated at 15 years after HFpEF diagnosis.

