Figure 2.
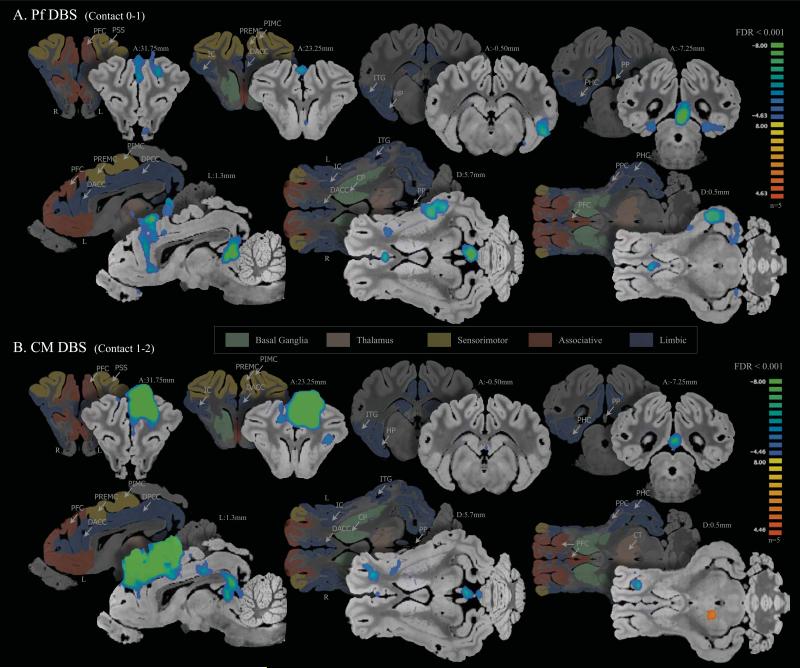
BOLD signal intensity change [%] response by DBS stimulation. The representative BOLD signal intensity change (y axis) for a single subject, an average of the five stimulation blocks in each volume of interest, is displayed here. Pf DBS (A) and CM DBS (B) each evoked a negative BOLD response in the sensorimotor, limbic, and associative brain areas. The negative BOLD signal intensity change increased as stimulation amplitude was increased from 3V to 5V (blue: 3V, red: 5V). The negative BOLD signal intensity change maximized at the termination of the stimulation. Abbreviations: BOLD, blood oxygenation-level dependent; CM, centromedian thalamic nucleus; DBS, deep brain stimulation; ITG, inferior temporal gyrus; PFC, prefrontal cortex; PIMC, primary motor cortex; Pf, parafascicular thalamic nucleus

