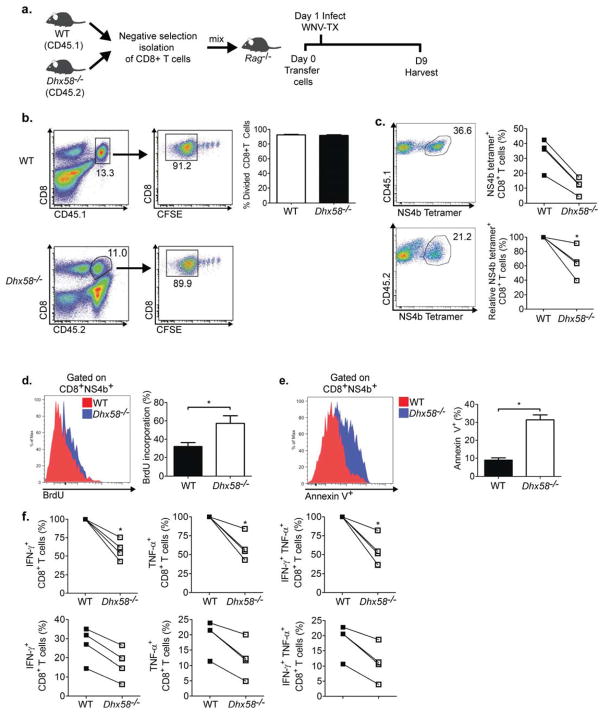
Figure 6. LGP2 directly regulates CD8+ T cell survival and fitness.
(A) Schematic of CD8+ T cell adoptive transfer into Rag1−/− mice. (B) Homeostatic proliferation of CD8+ T cells from WT (CD45.1) and Dhx58−/− (CD45.2) measured by flow cytometry (left-representative flow cytometry analysis and gating schematic; right-bar graph displaying frequency of divided CD8+ T cells). (C) NS4b tetramer-specific CD8+ T cells from day 8 p.i (each connecting line represents cells isolated from the same Rag1−/− recipient host; top-frequency; right-relative ratio of NS4b tetramer+CD8+ T cells), (D) BrdU staining of NS4b tetramer-specific CD8+ T cells from WNV-TX infected mice on day 8 p.i. (representative flow analysis and bar graph displaying frequency of BrdU+ staining) (E) Annexin V+ staining of NS4b tetramer-specific CD8+ T cells (representative flow analysis and bar graph displaying frequency of Annexin V+ staining), (F) total number of WNV-specific CD8+ T cells secreting IFN-γ (left), TNF-α (middle), or both (right). Relative to WT (top panel) and actual (bottom panel) percentages of CD8+ T cells isolated from the same Rag1−/− recipient host. Graphs show the mean +/− standard deviation (n=3). Data are representative of two or more independent experiments. Asterisks denote P < 0.05.

