
FIG. 2.
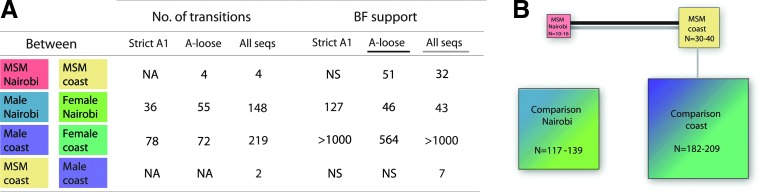
(A) Number and support of transitions among risk groups. Only Markov counts for well-supported transitions between risk groups are shown. NA, not applicable; NS, not significant. (B) Bayes factors test result schema showing linkages for A-like subtypes (black line) and across all study populations (gray line). The relative size of the boxes refers to the size of the population as shown in Table 1 for the various subtype selections.