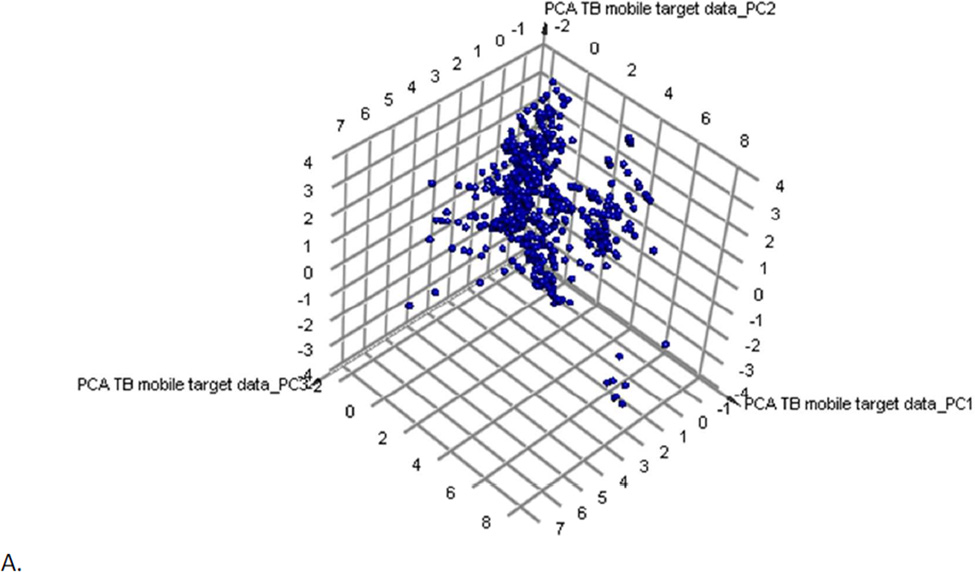
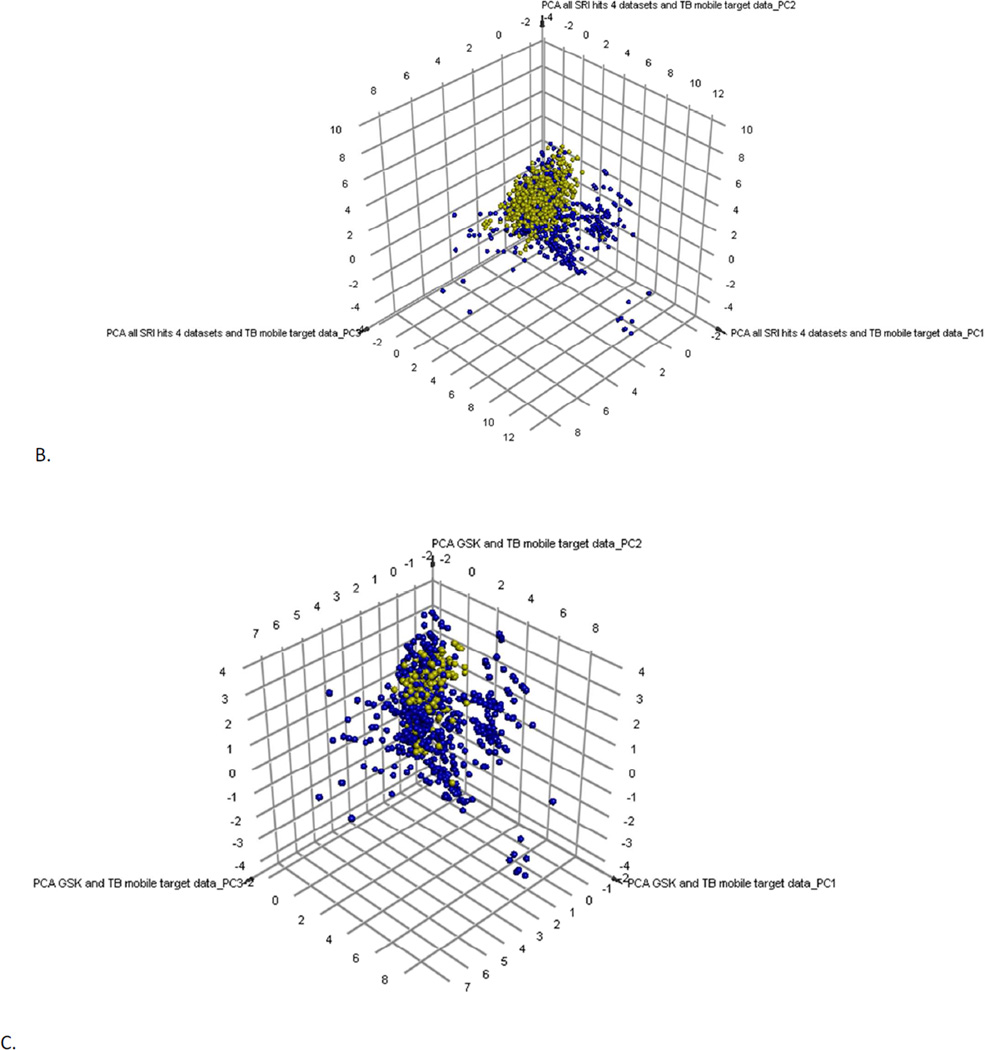
Figure 2.
Clustering and PCA of TB Mobile data. A. Examination of 745 TB Mobile molecules with interpretable descriptors results in a PCA with 3 PCs, which explain 88% variability. Outlier compounds represent macrocycles (bottom right) and long lipid-like molecules (bottom left). B. 1429 SRI hits from four datasets (active and non-toxic only, from the SRI screens where: IC90 < 10 µg/ml or 10 µM and a selectivity index (SI) greater than ten where the SI is calculated from SI = CC50/IC90) and 745 TB Mobile compounds results in a PCA with 3 PCs explaining 83% variability; SRI compounds are clustered (yellow). C. Examination of 177 GSK leads (yellow) and the TB Mobile compounds results in a PCA with 3 PCs, which explain 88 % of variance.


