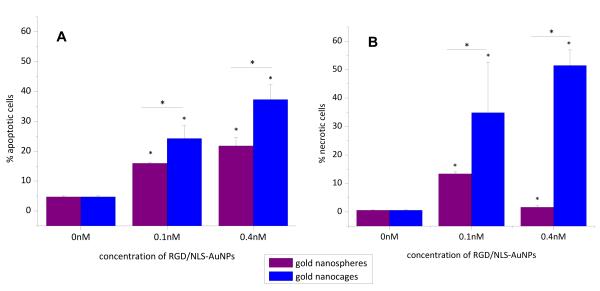
Figure 5.
Cell death, via apoptosis (A) and necrosis (B), induced in HSC cells after 48 h treatment with 0, 0.1, and 0.4 nM peptide-conjugated AuNSs (purple) and AuNCs (blue). The RGD/NLS-AuNCs, at 0.4 nM treatment concentrations, induce the greatest amount of cell death. Values expressed as mean ± standard deviation of three independent experiments. Statistical significance, with respect to control (above each bar) and between AuNSs and AuNSs (above each line) indicated by * (p < 0.05).

