Figure 1.

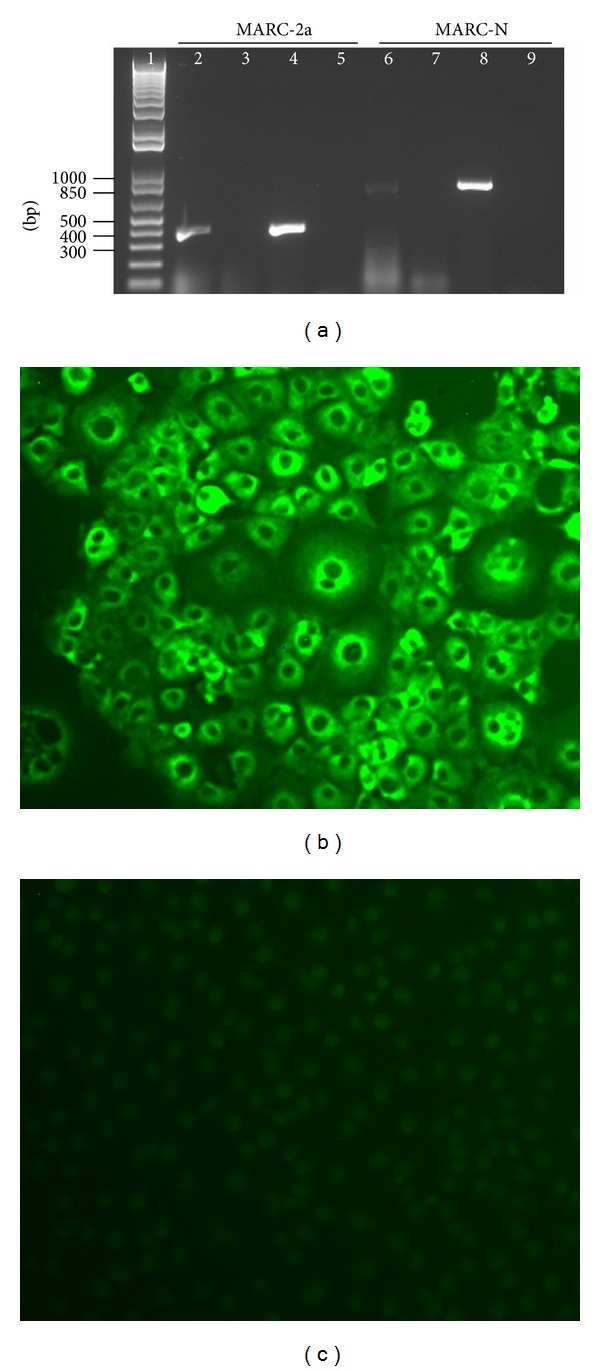
Characterization of GP2 and N expressing stable cell lines. (a) Agarose gel analysis. DNA was extracted from both cell lines and subjected to PCR amplification with primers specific to the 2a and N genes. Template amplification with no DNase and no reverse transcription (RT) treatment (lanes 2 and 6); template amplification with DNase treatment and no RT (lanes 3 and 7); template amplification with DNase and RT treatment (lanes 4 and 8); no template controls (lanes 5 and 9). Lane 1 represents the GeneRuler 1 kb Plus DNA Ladder from Fermentas. (b) Immunofluorescence staining of MARC-N cells to show evidence of the N protein expression. (c) Immunofluorescence staining of MARC-145 parent cells.
