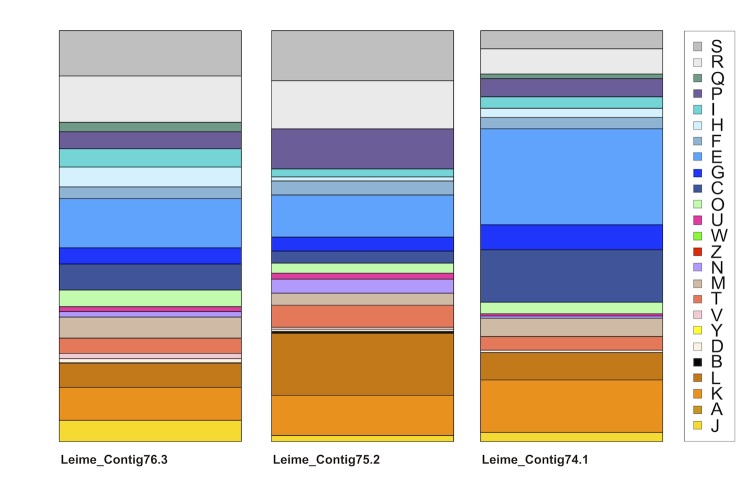
Figure 4.
Bar plot of the relative amounts of the COG categories of the chromosome (cMeth_4145 = Leime_Contig76.3, left) and both extrachromosomal elements (pMeth_A285 = Leime_Contig 75.2, center, and pMeth_ B221 = Leime_Contig74.1, right). The COG functional categories are described in Table 4.

