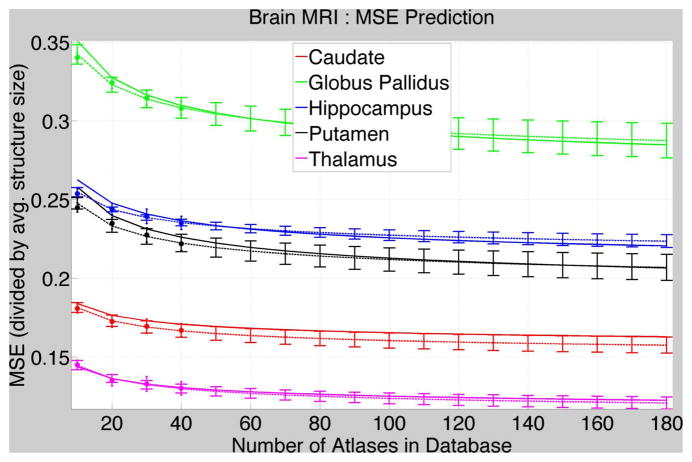
Fig. 3. Predicting MSE for Large Database Sizes using Small Databases.
MSEs (dot = mean value; error bar = standard deviation) and fitted curves (dashed lines; error bars = standard deviation on the fitted curve) using small databases (40 atlases) compared with the fitted curves (solid lines) using large databases in Figure 1.

