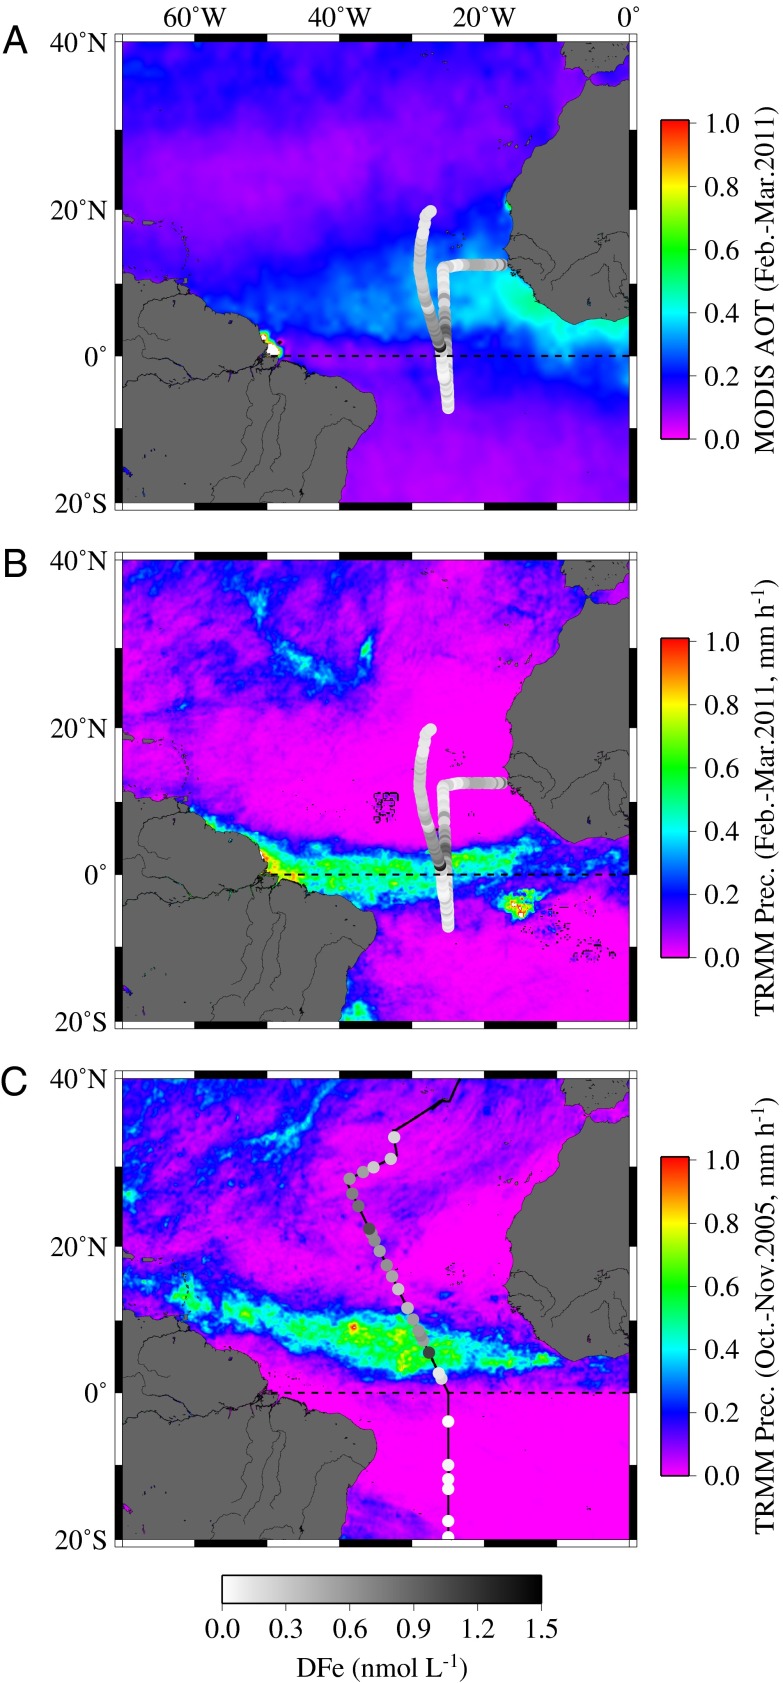
Fig. 1.
(A) Aerosol optical thickness (AOT) recorded by the MODIS satellite at 550 nm during February and March 2011. B and C illustrate satellite rainfall rates (TRMM) determined during D361 between February and March 2011 and during AMT-17 between October and November 2005. The black lines indicate the general cruise track and the gray circles the dissolved Fe concentration for surface samples collected in February–March 2011 (A and B) and October–November 2005 (C). The dashed line indicates the equator.

