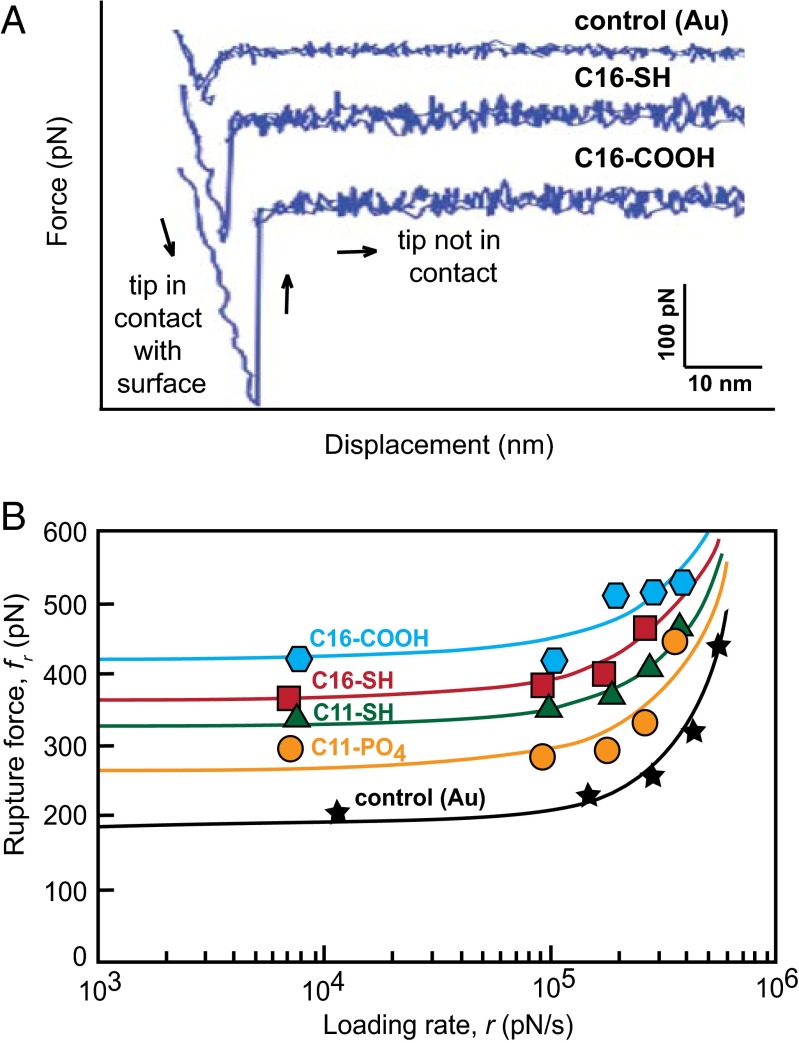
Fig. 3.
(A) Representative force curves for the control (Au-coated AFM tip) and two substrates (C16–COOH and C16–SH) show the differences in interaction strength with the calcite surface at the same tip retraction velocity (1 × 10⁻⁵ m/s). (B) Mean force of calcite–SAM rupture calculated from repeated force curve measurements decreases with the experimental loading rate, which is the product of cantilever spring constant and tip retraction velocity. All experimental substrates interact with the calcite (104) surface more strongly than the bare (gold-coated) tip. Solid lines denote exponential fits to the data.

