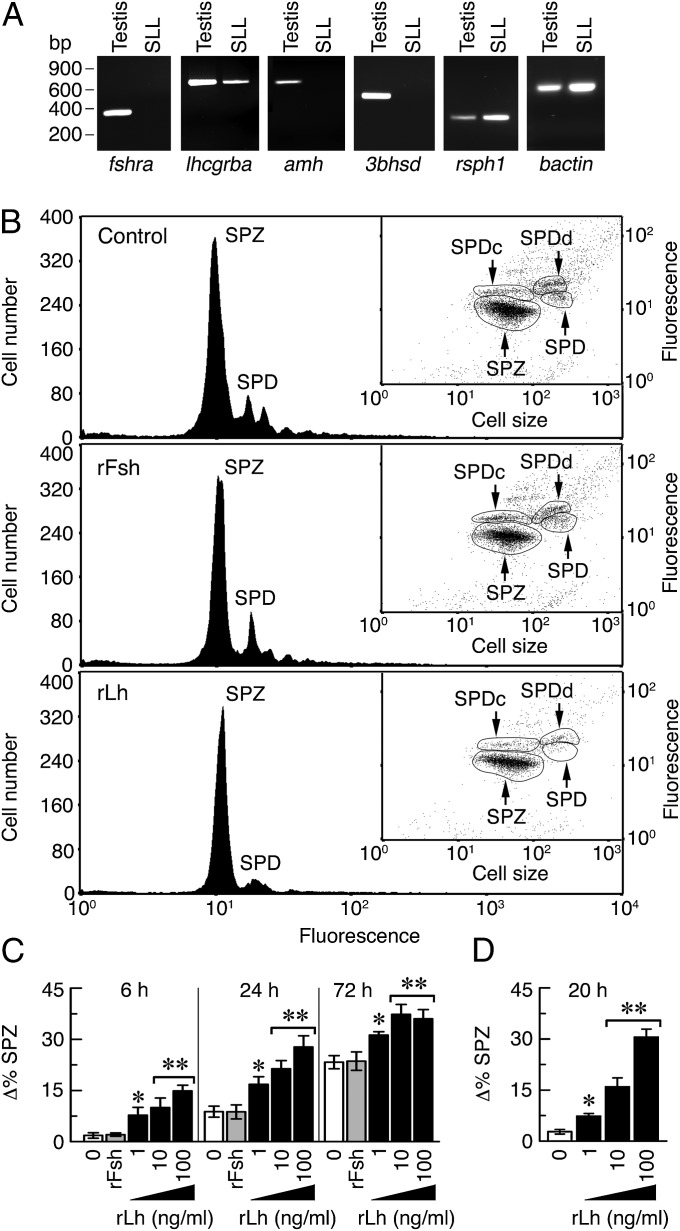
Fig. 4.
LH directs the transition of Senegalese sole spermatids to spermatozoa in vitro. (A) RT-PCR analysis of fshra, lhcgrba, amh, 3bhsd, rsph1, and bactin expression in testis and SLL crude cell extracts. (B) Representative flow cytometry histograms separated by SGI fluorescence intensity of SLL cells incubated with 100 ng/mL rFsh or rLh, or PBS vehicle (control), for 72 h (see Fig. S4B for time 0). Insets show the corresponding cytogram dot plots in which the haploid cell populations are separated by fluorescence intensity and side scatter, a surrogate of cell size. (C and D) Quantitative flow cytometry analysis of differentiated spermatozoa in the SLL extracts (C) or in FACS-purified spermatids (D) after treatment with rFsh (100 ng/mL) or rLh. Data (mean ± SEM; n = 5) are the increment in the percentage of spermatozoa with respect time 0. *P < 0.05; **P < 0.001, with respect to control cells. SPD, spermatids; SPDd, differentiating spermatids; SPDc, condensed spermatids; SPZ, spermatozoa.

