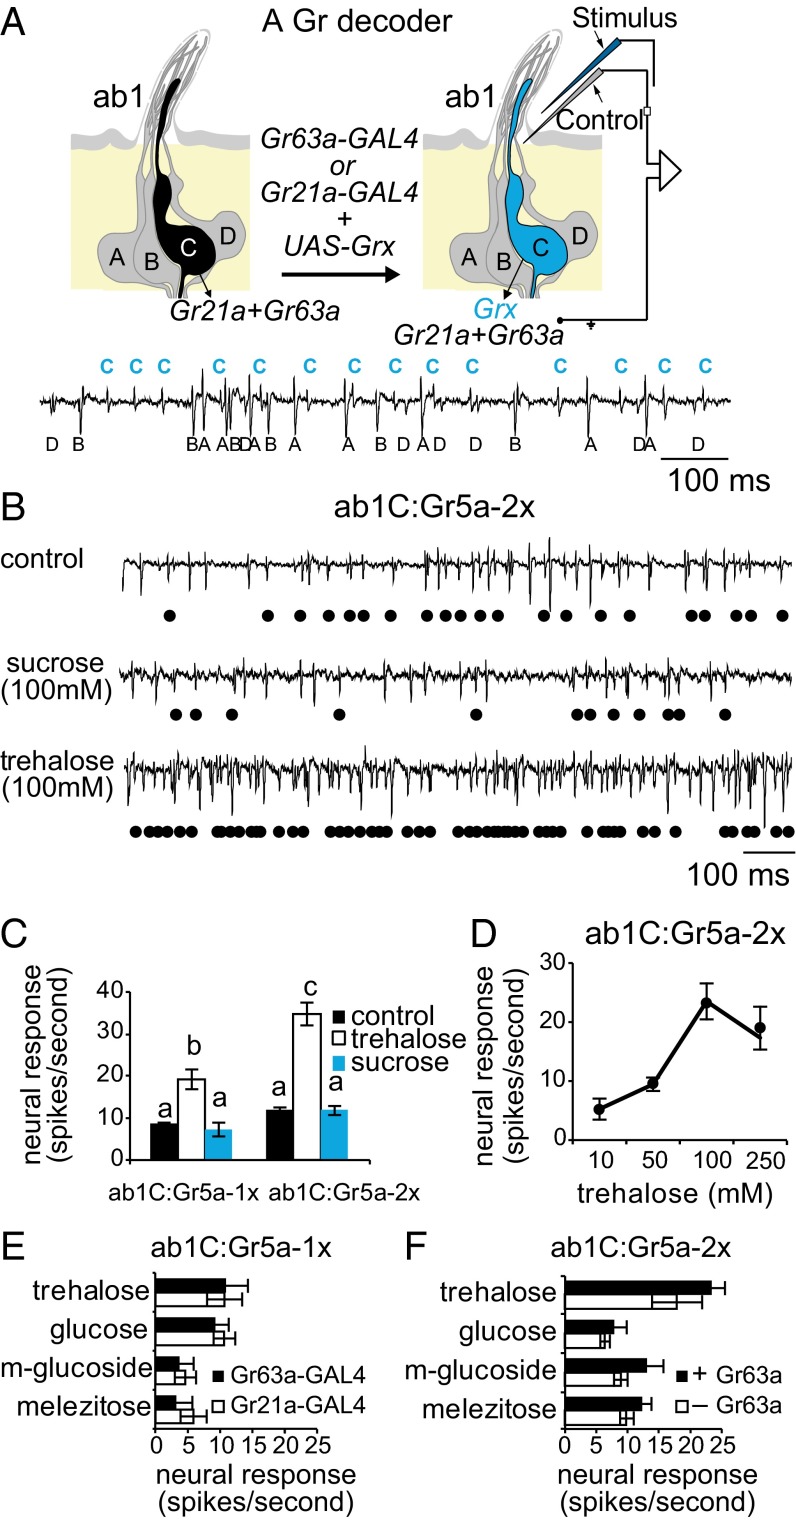
Fig. 1.
An in vivo ectopic expression system for analysis of individual Grs. (A) Schematic of ectopic expression in the ab1C neuron with trace from wild-type ab1 sensillum depicting activities of the four ab1 neurons. Glass micropipettes for tastant recordings contain sensillum lymph ringer (SLR) control (gray) or stimulus in SLR (blue). (B) Sample ab1 recordings in flies expressing Gr5a in ab1C neurons (ab1C:Gr5a-2x). Black dots indicate ab1C spikes. (C) Mean responses of ab1C:Gr5a-1x and ab1C:Gr5a-2x neurons. Baseline activity to SLR is not subtracted from stimulus-evoked activity. Sugars were tested at a concentration of 100 mM. Letters indicate statistical significance (P < 0.001; one-way ANOVA with Tukey’s post hoc test; n = 6–12). (D) Dose-dependent response to trehalose (n = 6–12). (E) Mean responses of ab1C:Gr5a neurons generated with Gr21a– or Gr63a–GAL4 as indicated to 100 mM sugars (n = 6). (F) Mean responses of ab1C:Gr5a-2x neurons in wild-type (+Gr63a) or ΔGr63a (–Gr63a) flies to 100 mM sugars (n = 10–14). All genotypes in E and F were compared with each other by using two-way ANOVA with Tukey’s post hoc test. Only genotypes with one copy of UAS–Gr5a (E) are significantly different from genotypes with two copies of UAS–Gr5a (F) (P < 0.05).

