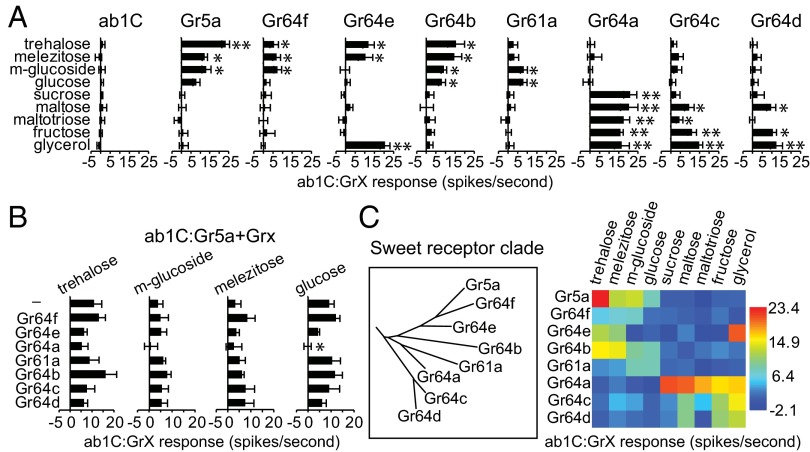
Fig. 2.
Tastant response profiles of sweet taste receptors. (A) Mean electrophysiological responses of ab1C:GrX neurons. All sugars were tested at a concentration of 100 mM, except maltotriose at 250 mM and glycerol at 10% (vol/vol). For each data point, n = 6–14. *P < 0.05; **P < 0.001 [vs. control ab1C flies (w1118)]. (B) Mean electrophysiological responses of Gr5a expressed alone (–) or with the indicated receptor in ab1C neurons. For each data point, n = 6–7. *P < 0.05; **P < 0.001 [vs. Gr5a alone (–)]. (C) Phylogenetic tree of sweet Grs (Left) and heat map of mean neuronal responses of ab1C:GrX neurons to indicated sweet tastants. Data are the same as in A. Heat map was made with PAST (http://folk.uio.no/ohammer/past).

