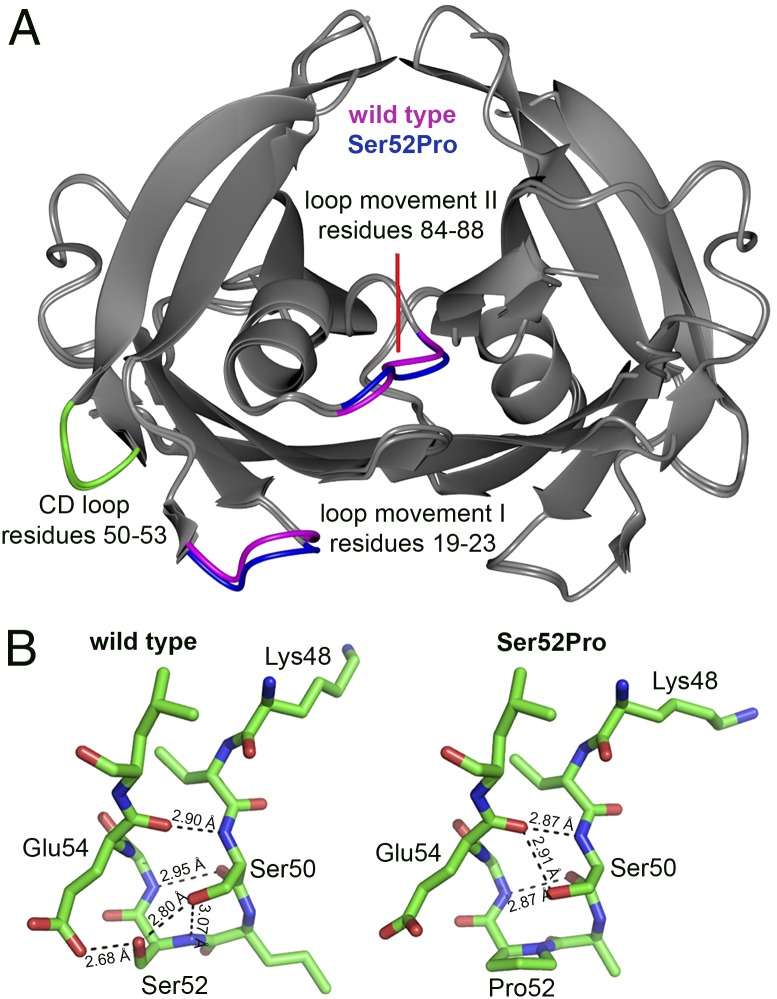
Fig. 4.
3D structure of wild-type and Ser52Pro TTR. (A) Crystal structures of wild-type and Ser52Pro TTR were superposed by secondary structure matching [gray-interpreted and presented by CCP4MG (27)] and show the close similarity of the folds, Rmsd = 0.42Å over 221 residues. Regions of greatest difference are highlighted in blue (Ser52Pro) and magenta (wild type). The CD loops for one subunit of both proteins are shown in green. (B) Stick diagram of the CD loop region (carbon is shown in green, oxygen in red, and nitrogen in blue) for wild-type (Left) and Ser52Pro (Right) TTR showing the diminished hydrogen-bonding network in the vicinity of the proline substitution that may contribute to the enhanced susceptibility of the variant to proteolytic cleavage at Lys48 (28). X-ray data statistics are reported in Table S3.

