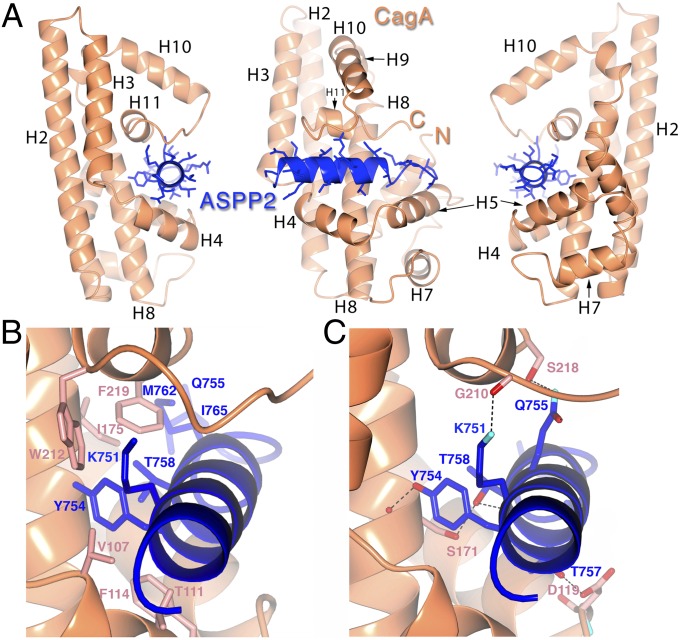
Fig. 2.
Overall structure of the CagA–ASPP2 complex. (A) Ribbon diagrams of CagA (orange) and ASPP2 (blue) in three different orientations related by rotations of 90° about a vertical axis. C, COOH terminus; N, NH2 terminus. Graphics were generated with CCP4 QtMG (55). (B) Details of the CagA–ASPP2 protein–protein interface. The focus is on the hydrophobic interactions between CagA and ASPP2. The protein main chain is shown as in Fig. 2A, with corresponding side chains of CagA and ASPP2 in salmon and blue, respectively. (C) Focus on the hydrogen-bonding interactions between CagA and ASPP2. The protein main chain is shown as in Fig. 2A, with corresponding side chains of CagA and ASPP2 in salmon and blue, respectively. Hydrogen bonds are indicated by black dotted lines, and the atoms of nitrogen and oxygen are show in blue and red, respectively.

