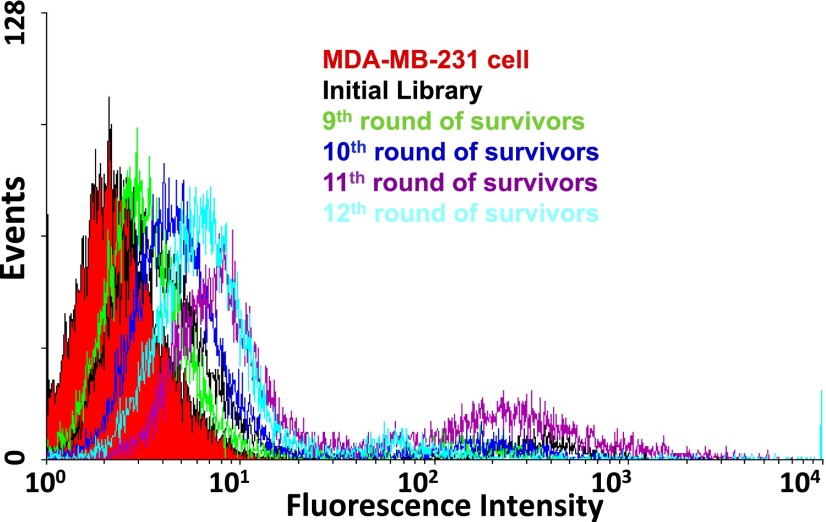
Fig. 3.
Monitoring the progress of GACTZP AEGIS Cell–SELEX using flow cytometer. Vertical axis indicates the number of cells counted having the fluorescence intensity indicated by the horizontal axis, with the increase in intensity from 9th round indicating the increased number of fluorescein-labeled aptamers bound per cell. Binding assays showed the enrichment of breast cancer cell (MDA-MB-231) binders with an optimum obtained after 11th round, and no further improvement after the 12th round.

