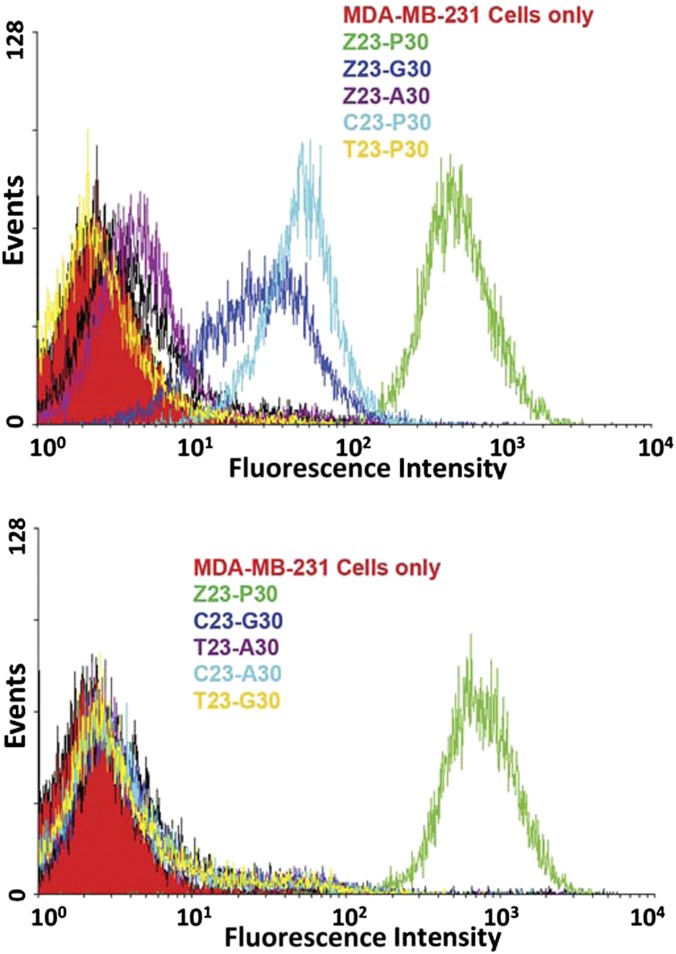
Fig. 4.
Flow cytometry measurement of the binding of chemically resynthesized ZAP-2012 aptamer (5′-biotin-TCCCGAGTGACGCAGC-CCCCGGZGGGATTPATCGGT-GGACACGGTGGCTGAC-3′, the random region is underlined) obtained using AEGIS Cell–SELEX to MDA-MB-231 breast cancer cells (green curve). The vertical axis indicates the number of cells counted having the fluorescence (from biotin-bound Cy5.5-conjugated streptavidin) intensity indicated by the horizontal axis. Also shown (other colors) are binding data for chemically resynthesized ZAP-2012 mutants. (Upper) Where the Z and P are separately replaced with standard nucleotides, binding affinity is reduced. (Lower) Where the Z and P are both replaced with standard nucleotides, binding affinity is lost.

