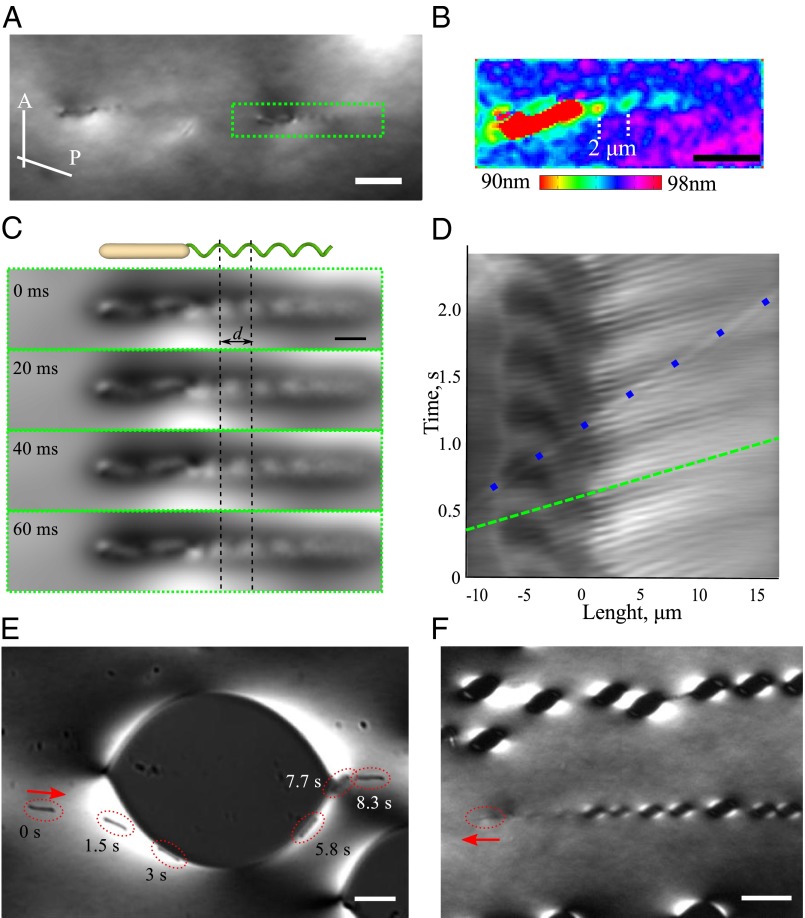
Fig. 1.
Distortion of the nematic director detected by optical microscopy. (A) Snapshot of swimming bacteria observed under a microscope with slightly de-crossed polarizer (P) and analyzer (A). The bacterium shown in green box swims from right to left. (B) Optical retardance pattern around a swimming bacterium; see also Figs. S1–S3. (C) Time evolution of the director waves created by rotating flagella in the comoving reference frame. (D) Space–time diagram for director waves extracted for the bacterium shown in C. A total of 240 cross-sections was extracted from 2.4 s of video. Dashed green line depicts phase velocity of the flagella wave. Dots mark an immobilized dust particle. See also Movies S1 and S2. (E) Trajectory of a single bacterium around a tactoid. (F) Trace of isotropic tactoids left by a bacterium at temperature about 0.5 °C below the nematic–biphasic transition point. Observations are made under a microscope with slightly de-crossed polarizer (P) and analyzer (A). Scale bar, 5 μm (A and B); 2 μm (C); 10 μm (E); and 20 μm (F). See Movies S3 and S4.

