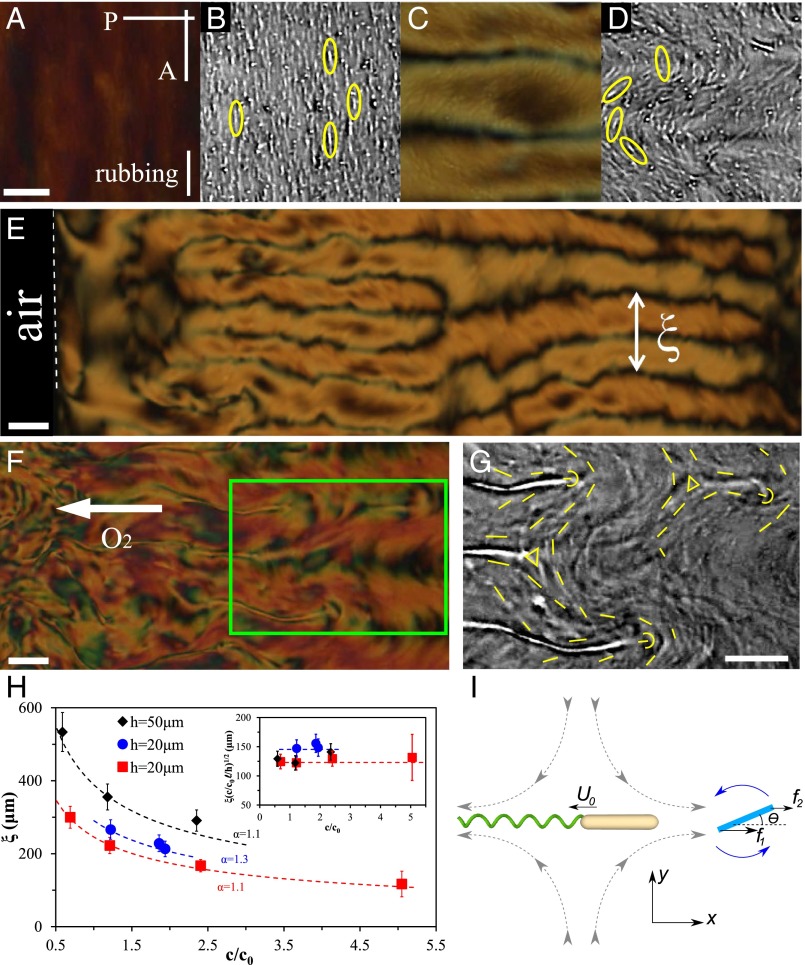
Fig. 2.
Emergence of a characteristic length scale in LLCs. (A and B) LLC with inactive bacteria is at its equilibrium state with the director and bacteria (highlighted by ellipses) aligned uniformly along the rubbing direction; (C and D) active bacteria produce periodically distorted director. (E) Proliferation of stripe pattern in the sample of thickness h = 20 μm and for low concentration of bacteria, c ∼ 0.9 × 10⁹ cells/cm3. Oxygen permeates from the left-hand side. (F) LLC patterns in thicker sample (h = 50 μm) and for higher concentration of bacteria, c ∼ 1.6 × 10⁹ cells/cm3. White arrow points toward a higher concentration of oxygen. (G) Zoomed area in F showing nucleating disclinations of strength +1/2 (semicircles) and −1/2 (triangles). Bright dashes visualize bacterial orientation. (H) Dependence of characteristic period ξ on c and h; dashed lines depict fit to theoretical prediction  . (Inset) Illustration of collapse of the data into a universal behavior that follows from the theoretical model. (I) Director realignment (shown as a rod) caused by the bacterium-generated flow (shown by dashed lines with arrows). See also Movies S5 and S6. Scale bar, 50 μm (A–D); 100 μm (E–G). Error bars, ±10% standard error of the mean (SEM), except for ±30% SEM at c/c0 = 5.05.

