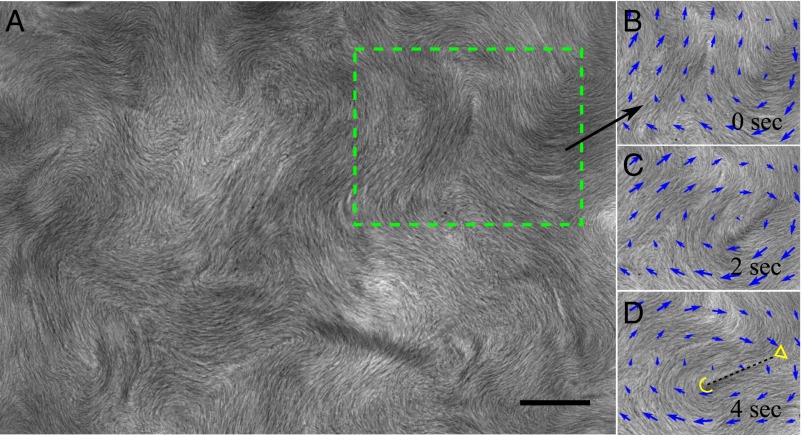
Fig. 3.
LLC in sessile drop. (A) Texture with multiple disclination pairs; green rectangle indicates the region shown in B, C, and D. Bacteria are aligned along the local nematic director, as revealed by the fine stripes. Scale bar, 30 μm; no polarizers. See also Movie S7. (B, C, and D) LLC texture with −1/2 and +1/2 disclinations and the pattern of local flow velocity (blue arrows) determined by particle-image velocimetry. The flow typically encircles the close pair of defects.

