Figure 7.

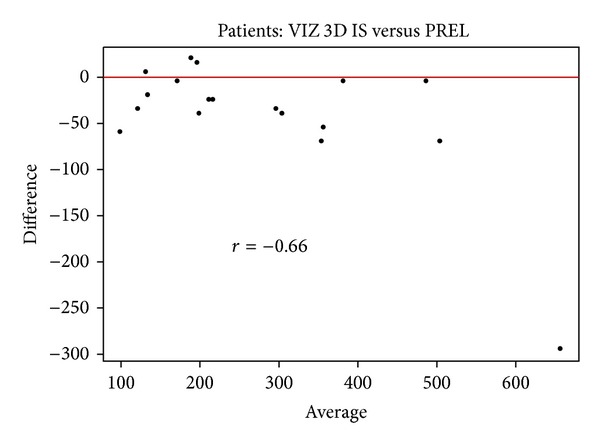
Bland-Altman plot comparing VIZ3D in situ versus VIZ3D sample from the bodies. This graph shows stability of measures; the difference between the measurements does not depend on volume.

Bland-Altman plot comparing VIZ3D in situ versus VIZ3D sample from the bodies. This graph shows stability of measures; the difference between the measurements does not depend on volume.