Figure 9.

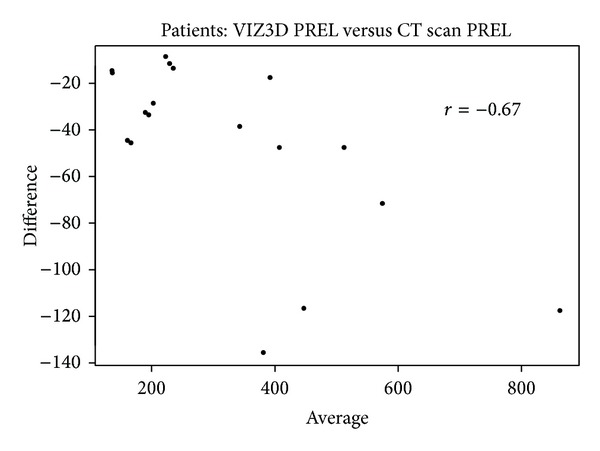
Bland-Altman plot comparing VIZ3D sampling versus CT scan sampling (parts of dissection). When comparing the volume with the reference method (here it was the CT scan), there was a mean difference of 47.2 ± 39.0 cm³ for VIZ3D method.

Bland-Altman plot comparing VIZ3D sampling versus CT scan sampling (parts of dissection). When comparing the volume with the reference method (here it was the CT scan), there was a mean difference of 47.2 ± 39.0 cm³ for VIZ3D method.